If you’re like most HR teams, your dashboard is not optimized. It’s a mess.
Every time an executive asks for a specific employee experience metric, you add a dashboard tile. Before you know it, there are eight different tiles, with corresponding numbers, all sitting on the same screen. And no one has the power - or the appetite - to take any of them down.
So what do you actually do with those numbers every Monday morning?
Do you focus on the fact that employee engagement levels went down? Or that employee referrals went up? Or that rates of absenteeism stayed the same?
When you’re trying to decide which metrics are "good" and "bad" for measuring the employee experience, remember that the more useful question is, "How much lead time does this metric give me? Is this a number I can act on, or is it a record of decisions my employees made two quarters ago?"
You’ll also notice that some popular employee experience metrics are downright misleading. For instance, the number of kudos given to employees might go up the same quarter your survey comments say managers aren’t listening to their employees.
Employee experience KPIs - leading vs lagging - What decision do you want to make?
- Measure anything, as long as it leads to a change in decisions
- Consider the scope of your dashboard before you create it
- Leading indicators give you time to act
- Lagging outcomes only tell you what already happened
- An attractive metric may lead you to solve the wrong problem
- Assign a realistic review cadence to each metric
- Be mindful of where your survey data breaks down
- How Sparkbay can help you turn employee experience data into decisions
Measure anything, as long as it leads to a change in decisions
Douglas W. Hubbard, author of How to Measure Anything, says the only reason to measure anything is to reduce uncertainty about a decision.
He also warns about a "measurement inversion" where companies measure what’s cheap and easy to measure, but don’t measure the variables with the highest information value.
HR dashboards are a textbook example of this problem. It’s easy to automate the count of activities, but much harder to measure variables like the quality of managers or sustained workload that are more likely to inform a different decision.
Suppose you have a tile that tells you your employee engagement has dropped since your last pulse. You also know, based on your driver questions, that this drop is due to a change in employee workload in two of your nine teams. You’ve got what you need to know as you understand which managers need support and in what kind of support.
On the other hand, does it make a difference to know that 2,400 recognition messages were sent last quarter? What would you do differently if you knew that message count was 1,800 instead?
Before you start gathering data, write down the types of movements in this KPI/Metric that will trigger action and what that action will be.
Without a pre-committed trigger for action, it’s easy to brush off movements in data as they happen, and ultimately prevent change.
For instance, a half-point decrease in an employee engagement score across a department of 800 employees may warrant a reaction, but the same decrease on a smaller team of 12 might be within the realm of normal variation. On small teams, you may want to set a trigger that requires a sustained movement across two consecutive pulses.
It’s also worth noting whether the right person will be empowered to make a change within your business.
If your HR team identifies a pattern related to workload but the only person who can approve more headcount is a department head, then it’s not useful for that team to have a dashboard tile labeled "time to act". All a manager can do is change the cadence of one-to-one meetings; they can’t address the pay gap.
Sometimes, the purpose of a specific number is to help leaders ask better questions.
That’s fine, but it warrants a different, secondary view presentation.
Consider the scope of your dashboard before you create it
Different teams may own different stages of the employee journey, such as onboarding, development or the exit process.
Each team will have its own data points and reporting. You don’t want to recreate their reports. Instead, decide which pieces you want to include as part of your main dashboard and which you want to link to.
The most helpful thing your EX dashboard can do is help you understand where the employee experience diverges from expectations and for which employees this is happening.
You know that what you say about employee experience (e.g., nice words on a careers page) and what you deliver (e.g., actual experience after 90 days) are different. By segmenting your data by tenure, location, and role family, you can find the biggest gaps instead of looking at the company average.
Be cautious about using external benchmarks. For instance, global research studies from Gallup consistently find that the majority of employees are not engaged.
This means that if you only compare yourself to "the market," you may think you’re doing well when in fact you’re "above average" performance is causing complacency.
The difference between your best teams and your worst teams is often more helpful than your difference from an external benchmark, since you can control the conditions that lead to this variation.
Keep in mind that employee experience cannot be captured in a single question. Consider your headline, overall score as a map guide.
Leading indicators give you time to act
An engagement score anchors your organization’s efforts
Having a single engagement score out of 10, based on the responses of your employees, gives organizational leaders a single number to track over time, and compare across different groups. This also gives you a set of drivers to understand the different components of the score and explain why the score changes.
Before reporting a change in your employee engagement score, understand:
- The response rate. If your survey previously had an 80% response rate, but now has only a 55% response rate, it’s important to understand who didn’t respond to your survey? Often, disengaged employees are the first to opt out, meaning your score could be inaccurately optimistic.
- The distribution of responses. Even if your average score stays the same, there may be different trends happening under the radar. Perhaps your team is split between strong supporters and employees who are considering leaving.
- The size of the group. If you have a small team of 12 people, your score can fluctuate much more than a department of 800.
You also want to avoid creating a second headline score like a satisfaction index that sits alongside the engagement score. When your leadership team has two different headline scores, meetings get derailed by discussions on which score is more accurate.
Understanding drivers helps you focus your attention
With driver questions for topics such as recognition, growth, workload, autonomy, and relationship with manager, you can turn an engagement score into a conversation about how work actually gets done within your organization.
Suppose two teams report the same level of employee engagement. One feels overwhelmed and overloaded, while the other team wants to increase the level of decision-making within their team. If you send the same action-plan template to both managers, you’ll waste both of their times.
Focus on driver questions where employees score low and there is a strong association with overall score. That said, be cautious about doing a "top driver analysis at the team level. If you only have 15 responses, your top driver" may simply be random noise.
Consider doing your driver analysis at the department level, then use the results from individual teams to see if those department-level trends hold.
Gallup research attributes the largest share of between-team variance in employee engagement to the manager. This doesn’t mean that the manager is always to blame for a low employee engagement score. Reorganizations, understaffing, and pay issues are often outside a manager’s control.
But it does mean that understanding your results at the team level are important and meaningful, once you have a large enough team to report on safely.
Pulses let you know if an intervention worked, but only if your employees see the intervention. If your workload employee engagement scores go down, an effective intervention is for your manager to sit down with their team to understand what specific tasks are contributing to this load, and change how work is allocated. But then they need to communicate those changes to their team before the next pulse.
eNPS gives you a second opinion
eNPS asks your employees how likely they are to recommend their current company as a place to work. While eNPS is not meant to replace your engagement score, it can be a helpful secondary leading indicator alongside your engagement score.
Understanding what the eNPS truly measures is important. It’s possible for someone to recommend your company because of the pay or the brand, while feeling stuck in their current team. On the other hand, an employee may love their job, but not want to recommend such a demanding role to a friend.
The method of scoring eNPS also creates blind spots. By subtracting the number of detractors (0 - 6) from the number of promoters (9 - 10), the eNPS score completely ignores the responses of passives (7-8). This means that a shift from a 6 to a 7 on the eNPS questionnaire (from a detractor to a passive) is reflected in the results while a shift from a 7 to an 8 is not.
The eNPS could show no change, even if a team gradually improves their sentiment while moving up in the passive band. Different response styles based on country can also make cross-country comparisons of eNPS results unreliable.
And finally, eNPS scores can change dramatically based on a single response if the group is small.
Lagging outcomes only tell you what already happened
Retention rates are lagging metrics
By the time you see an employee in your turnover rate, they’ve usually been considering leaving for months.
It’s also not particularly helpful to look at a general turnover rate.
Try breaking down your turnover rate by regretted and non-regretted turnover, tenure band, and role criticality.
High levels of turnover in the first year may point to issues with your hiring process or onboarding. High turnover between three to five years may have more to do with growth and pay opportunities.
You might have a great overall turnover rate, but that statistic could be hiding the fact that you replaced an entire, hard-to-recruit team in the span of a single quarter.
In a survey from Pew Research Center, low pay and lack of advancement were among the most cited reasons for quitting a job.
So before investing in funding coach managers, you may want to conduct a preliminary analysis to see where employees who quit and employees who stayed in the same roles sit within their pay ranges. If most employees who quit are at the bottom of their pay range, a pay-positioning hypothesis may be worth exploring.
Absenteeism rates need context
On the surface, absenteeism can be an interesting data point for understanding employee workload and working conditions.
But absenteeism rates can also be impacted by waves of illness or changes to sick pay policies.
It’s also important to distinguish between frequent short absences and long-term absences.
And again, comparing absenteeism rates across groups of people doing similar jobs can be helpful.
Suppose you notice that absenteeism rates decrease for a group that reports poor working conditions related to employee workload. Are employees afraid to take time off? Are they worried about what will happen when they return?
It’s also possible there’s another, more benign explanation.
But rather than drawing your own conclusions, it’s better to flag this observation for your HR partner or department head.
And even then, it’s important not to take decreased absenteeism rates as a positive sign of employee health until associated workload scores report improvements as well.
Finally, it’s important to stress that managers should not use an employee experience dashboard as a prompt to investigate individual sick days.
Employee referral rates are an honest sign of trust, but they only show progress after the fact
When employees make referrals, they’re putting their own reputation on the line, so this is a pretty bona fide sign of how people view your company outside work.
But a simple count of referrals isn’t that useful, since it’s impacted by the number of open roles and the mechanics of the referral program.
For instance, a hiring freeze or a decision to reduce the referral bonus will impact referral rates regardless of how employees feel.
If you have enough hiring volume, you can normalize this number by calculating referrals as a percentage of hires or number of referrals per number of open roles.
If possible, you can also track the retention rate of referred hires.
Comparating referral data to engagement and retention data can give you a good indication of how things are going, but only after the fact.
An attractive metric may lead you to solve the wrong problem
Productivity is not the same as activity
Productivity is one of the top metrics executives ask for.
The problem is that what’s easiest to measure and report often winds up defining "good" work.
For instance, "number of tickets resolved" may be a good metric for a support team (if ticket complexity remains consistent). But "number of clicks" or "hours in the office" is not.
If you want to include an output-focused metric, keep it in a separate view for context and only for roles where it truly demonstrates value.
When posing the EX question about productivity, ask employees to identify instances of friction. Which tools, approvals, or hand-offs are creating bottlenecks for them?
And above all, don’t use these productivity or output metrics as a threshold for taking employee complaints about their work load seriously.
Answering wellness questions requires a level of trust
Answering questions like "Are you stressed?" is hard to do honestly. If there isn’t enough trust within the organization, survey responses will mostly demonstrate who felt safe enough to answer.
Gallup’s research on burnout shows that a pretty big share of workers (23%) feel burnt out either very often or always.
So if your survey results are very reassuring for wellness questions, take them with a grain of salt since the most burnt out individuals may not have bothered to participate.
Before trusting your survey responses, check your participation rate by groups and ensure anonymity.
When asking wellness questions, address topics related to the work environment that you can change such as: workload during busy periods, ability to recharge between intense workloads, and ability to unplug.
And don’t ask for personal health information disclosures. This limits how forthcoming employees will be, and in many jurisdictions creates legal responsibilities that a simple employee engagement survey is not designed to address.
Recognition frequency doesn’t tell you about the quality of recognition
Counting the number of thank-yous delivered measures the volume of recognition, but it doesn’t tell you whether the right people are being recognized.
You need to assess the flow of recognition as well. Are people only being recognized within their teams? Are certain high profile roles receiving all the recognition?
Are remote workers or frontline workers being recognized less?
If you combine your recognition flow data with fairness data derived from a statement like "I get credit for my work" and you do a comparative analysis across teams, you might realize that no amount of kudos is going to change the culture of teams where managers take credit for their team’s work.
Assign a realistic review cadence to each metric
Not all metrics need to be reviewed on the same timeline. Reviewing a metric more often than it can meaningfully be influenced won’t speed up change - it will only increase the risk of overreacting to noise.
Try to assign each metric a review cadence that corresponds to how fast someone can act on it and how fast you’ll notice the effect of that action.
| Metric | Metric type | Realistic review cadence | Why? |
|---|---|---|---|
| Engagement score and engagement drivers derived from employee survey | Leading | Monthly or quarterly | This matches how quickly a manager can act and how fast employees will notice the change. |
| eNPS | Supporting signal | Quarterly | eNPS is based on a single question with a coarse scoring rule. It takes time for real changes to show up in your data, so short-term changes are largely noise. |
| Absenteeism | Lagging outcome | Monthly (rolling trend) | Seasonal illnesses and policy changes can distort results for a single month, so it’s better to look at the rolling trend. |
| Retention | Lagging outcome | Quarterly to annually | At the team level, you won’t have enough people leaving in short time periods to distinguish a trend from randomness. |
| Internal referrals | Lagging outcome | Quarterly to annually | This metric depends on factors like hiring volume and programme design. |
Use these recommended review cadences as a guide rather than a strict rule. Depending on the size of your operation and how consistently you’re hiring, you may have enough data to analyze your internal referrals on a quarterly basis. You may need to wait longer if you’re a small, specialized unit.
Be mindful of where your survey data breaks down
Small teams may present anonymity issues
Suppose you have a team of six and four people respond to a pulse. If you report on this team alone, people may not feel like their responses are anonymous, especially if someone comments on a specific project.
You may also run into differencing problems. If you report the total responses for a department, and someone can view the responses for every individual team within that department (except one) they may be able to subtract the data to see the suppressed team’s results. This isn’t avoided by simply setting a minimum response threshold.
If you suppress one team’s data, you need to check whether the difference between the parent level roll up, and the visible sibling teams results in exposure of your suppressed team’s data. If that’s the case, you’ll either need to suppress another sibling team or choose to only report results at the parent level.
It’s a good practice to set a minimum number of respondents (usually around five) before results are displayed. However, you also need to take a close look at your team structure when deciding on your minimum response threshold. You may decide to report on small teams by either combining them into another reporting unit or by combining responses over an extended period of time.
If these options aren’t feasible, consider distributing a facilitated qualitative check-in.
Changes in question wording can impact trend data
At first glance, "I have the resources I need" and "I have enough time to finish my work" may seem like interchangeable statements. However, they aim to address different pain points and will likely generate different trends over time.
Keep a version log for each survey item, noting the wording, scale, and position within the survey. If any of these things change, indicate the change on your chart, and start a new trend line. If maintaining trend continuity is important, you can use the old and new question wording for a cycle or two to assess differences between the two phrasings.
Keep a log of when your surveys are distributed as well. If you distribute a pulse the week after bonus letters go out, or in the middle of a reorganization announcement, this timing may impact the results. You can annotate your chart to let readers know when there are special events to consider that may impact interpretation of a trend.
If this sounds overly fastidious, imagine celebrating an incredible increase in satisfaction during a leadership meeting only to learn that the increase had nothing to do with your efforts and all to do with a change in question wording. Research from Pew Research Center highlights just how impactful small changes in question wording can be on responses.
Correlation does not equal causation
Suppose you notice that teams that send the most recognition messages also happen to perform well on engagement. It doesn’t mean that launching a "send more kudos" campaign will cause an improvement in engagement.
An alternative explanation is that good managers are behind both trends. Another possibility is that struggling teams have stopped using a recognition channel they don’t trust.
To test the impact of a potential driver, pilot your driver change. Agree on which driver you expect to change, and evaluate your evidence by also selecting comparison teams before your pilot even begins. Then determine if there is a change in your driver within your pilot teams that is not present in the comparison teams.
How Sparkbay can help you turn employee experience data into decisions
Sparkbay runs engagement and driver questions as regular pulses. This allows you to see how a change in workload affects your employees without having to wait for the annual survey.
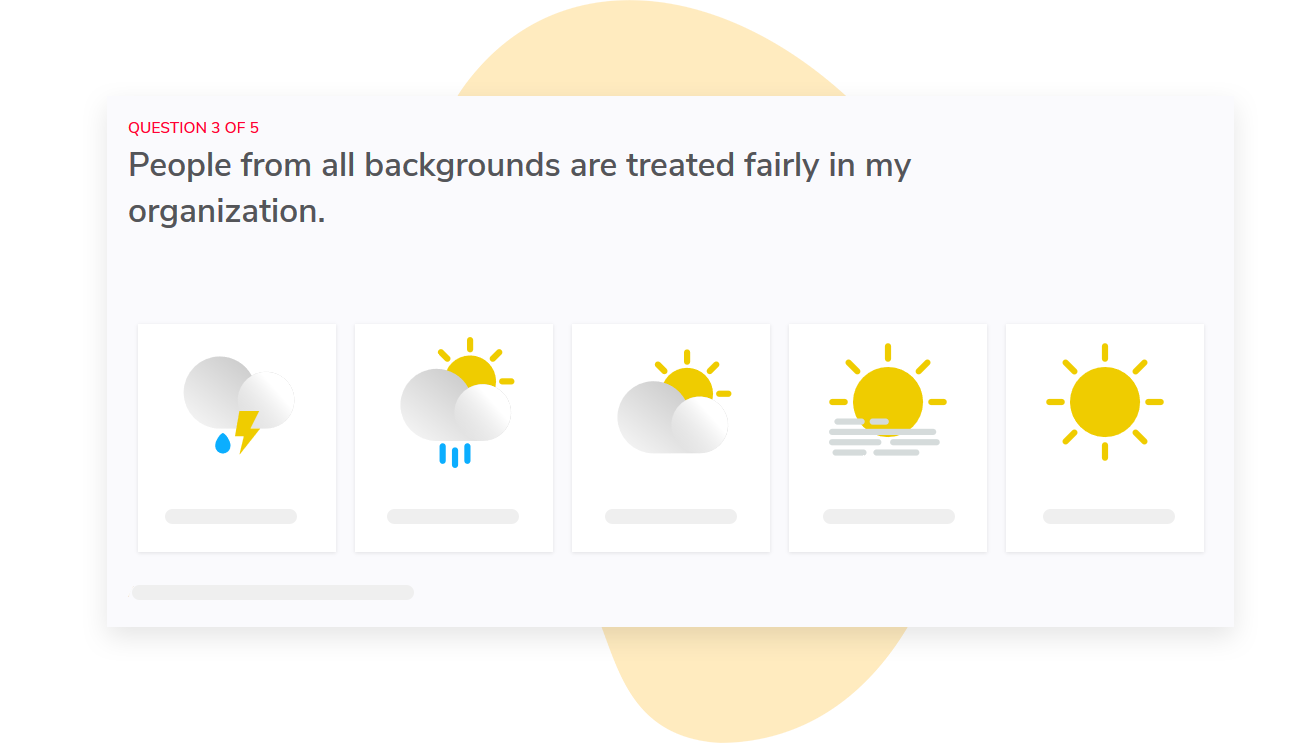
In the dashboard, you can view your engagement score (out of 10) and drill down to the underlying questions to see what contributed to your score.
You can customize the wording of both your surveys and dashboards, as well as what each dashboard displays. This makes it easier to keep your decision metrics front and center and move contextual metrics to the background.
When your scores change, you need to know where they changed. Sparkbay allows you to compare your results with different groups within your organization. This helps you understand whether a company-wide change is experienced by many departments or just one.
Access to reports is automatically mapped to your org hierarchy, so each manager only sees reports for their teams.
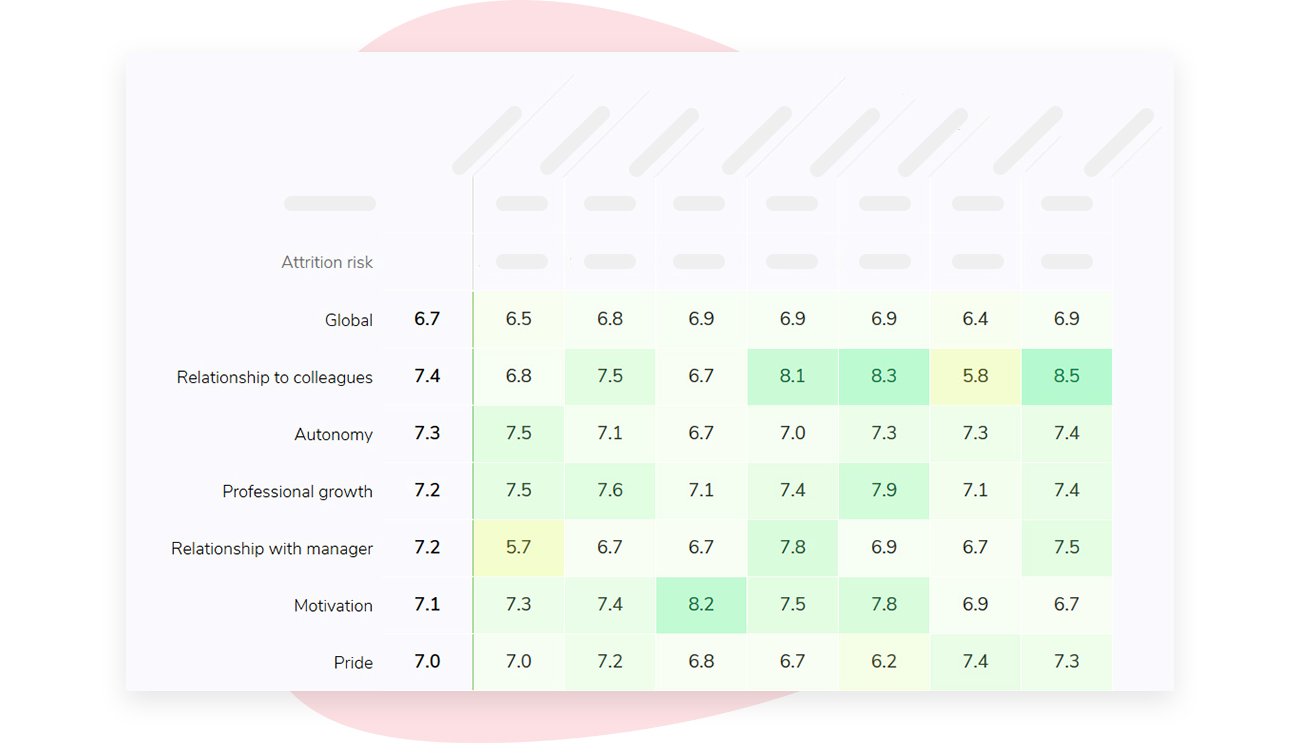
Anonymity is key to collecting honest data. That’s why Sparkbay ensures your data remains anonymous by hiding data if not enough people have responded. By default, the system hides data if less than 5 people respond, but you can change this based on your organizational structure.
If you’re interested in learning how Sparkbay can help you build a more engaged workforce, you can click here for a demo.
Assign a KPI owner and decision point
For each of your KPIs, ask yourself, "If this number moves, who is looking at it, and what are they empowered to decide?"
| KPI | Decision informed by KPI | KPI Owner |
|---|---|---|
| Engagement driver score | Select a coaching priority or change how the team allocates work and then monitor progress at the next pulse | Manager and HR partner |
| Regretted turnover | Compare leavers’ pay positioning and career progression to others in the same role who stayed before selecting a remedy | HR leadership and department head |
| Rolling absence rate | Identify whether this is short-term or long-term absence and then look into workload patterns and working conditions | Department head and HR partner |
| Employee referrals | Rule out changes in hiring volume or referral programme design before interpreting referral trends as sentiment | Talent team |
This usually means putting the engagement score and engagement drivers at the top of the dashboard, with retention and other outcome KPIs below.
KPIs like recognition and role-specific output measures can reside in a separate dashboard where the team that owns those KPIs has the context they need to use them.
If you’re interested in learning how Sparkbay can help you build a more engaged workforce, you can click here for a demo.