
How can you adapt your survey questions, protect honest employee feedback, and draw accurate global comparisons?
In The Culture Map, Erin Meyer highlights how people in different countries interpret the same words differently.
Consider this: You distribute an engagement survey to employees around the world. Global results come back, and your office in Tokyo scores 20 points lower than your team in Brazil in terms of percent favorable.
As an HR leader, you wonder whether there’s been a dramatic issue in your Tokyo office. Your regional leaders may wonder the same thing.
In reality, your Tokyo office may not be experiencing a crisis.
Response-style research demonstrates that East Asian respondents are more likely to give answers that fall in the scale’s midpoint, while Latin American respondents are more likely to feel comfortable using the higher end of the scale. Combine this with the norm of not criticizing a manager in writing - even anonymously - and you can see how a 20-point difference may be caused by response styles more than lived experiences.
Global companies often make a fundamental mistake when distributing employee engagement surveys. Their head offices write the survey in one language, send it through translation, and then consider each language a "perfectly equivalent instrument."
In reality, they might be comparing apples to oranges while making important resourcing or leadership decisions.
What’s more, if head office uses this information to push through an action plan for that office, local leaders may learn that employee engagement surveys penalize them for their culture. This can lead to even less honest responses the following year.
How national work cultures shape employee survey responses, and how multinational organizations can adjust question design, benchmarks and follow-up for each country
Culture remaps your survey measures
A seemingly simple survey question can get complicated when you consider cultural differences.
For example, consider the question, "On the whole, I feel comfortable speaking up at work". The answer to this question depends on what "speaking up" will cost an employee.
In one office, disagreeing with a manager in a meeting implies that you care about your work, so you speak your mind. In another office, employees prefer to save these conversations for one-on-one meetings. Both offices can value candor, but these two groups can have orders of magnitude difference comfort levels when answering the question, "I feel comfortable challenging my manager’s decisions."
You can use culture concepts like Geert Hofstede’s cultural dimensions to identify which survey questions are more likely to cause problems. Power distance can highlight items that refer to challenging managers or upward communication. Individualism can help you identify items that focus on the "I" instead of the "my team" approach.
However, Geert’s cultural dimensions serve as general indicators for a country’s population. Applying cultural dimensions and then applying them to a very small group of employees is a practice Geert himself warned against in his book, Culture’s Consequences. This is called the ecological fallacy.
Plus, your workforce may not be a representative sample of that country’s population. The engineers in a Japanese multinational may not match the larger country’s population for these cultural variables.
In practice, use your country-level cultural influencers to determine where you want to implement a test. You probably shouldn’t use it to pre-judge your survey results.
It’s also important to think about what "country" means to your survey data. Your Singapore or Dubai office may have employees from a dozen different countries. Your survey results may include responses from expatriate managers responsible for on-the-ground teams of local employees.
By slicing your data by location, you could be merging two extremely different response styles.
If your data set is large enough, consider dividing your survey results by language of survey in addition to location.
Other cultural concepts are important when interpreting survey results. Erin Meyer’s cultural research draws a distinction between "upgraders" and "downgraders" of criticism.
Interpretation is key. In a downgrading culture, a mild response might be a form of criticism. An employee might choose a "neutral" response simply because they don’t want to rock the boat.
On the other hand, "neutral" could also be a way of signaling that there is a problem without explicitly stating it.
Erin Meyer’s research also points out that cultural scales are relative within cultures. It’s not as important to know where a culture sits on an absolute scale as it is to know where that culture sits compared to the person reading the results. If your head office is in a direct-feedback culture, you might read a subtle hint in the results as a sign that all is well while your colleague from the respondent’s culture might read that as a sign of a serious problem.
Essentially, any biases you want to correct for need to take into account where your review team is on that cultural scale as well.
How do you identify differences in interpretation?
You can ask your local HR teams important questions like, "Would an employee feel like this is a negative reflection on Leadership X?", "Would a person giving an honest answer put a neutral answer on this item?", and "In their response, would they think mostly about their team or the organization as a whole?"
Even better, you could conduct a few cognitive interviews where local employees respond to the survey and share their interpretation of the question. This way you can hear for yourself the kind of reinterpretations local teams might make.
Cross-cultural survey research has discovered that a question can function differently across countries, even when it’s been translated accurately.
Watch what happens at the ends of the scale
Someone who rarely chooses "strongly agree" can lower a country’s average without feeling any less engaged.
Researchers separate acquiescence (agreeing regardless of content), extreme responding, and midpoint responding. Cross-country studies have found differences in all three, though the size and direction depend on the question and the group.
That’s why the Tokyo and Brazil gap deserves a closer look before anyone ranks the offices.
Work through it in order, because each step can make the next one irrelevant.
First, check who answered. A low response rate, or a sample tilted towards one function or tenure band, can explain a gap before response style even comes into it.
Second, look at the distribution. If one location’s midpoint share is elevated on nearly every item, including low-stakes ones like tools and resources, you’re probably looking at response style. If the gap is concentrated on manager and voice items, it’s more likely to be real, or to reflect a safety problem.
Third, compare the rank order of items within each location. If Tokyo’s weakest items match Brazil’s weakest items, the two offices share the same problems at different volumes.
Only then read the comments for what the numbers can’t show.
Check which metric your dashboard reports. A top-box figure (only "strongly agree") amplifies differences in extreme responding. Percent favorable (agree plus strongly agree) dampens that effect but does nothing about acquiescence.
Comparing each office with its own history is more robust, provided the wording, scale and language version stayed the same.
Balanced wording can help, but don’t fill a survey with reverse-worded statements just to catch automatic agreement. After translation, negatively keyed items often cluster together statistically, which tells you more about wording than about the construct. I don’t feel unable to speak up is hard to answer in any language.
Measurement invariance testing tells you what kind of comparison your data supports. Metric invariance lets you compare relationships, such as whether manager support drives engagement in every country. You need scalar invariance before you can compare averages, and many global instruments don’t reach it on every item.
Anchoring vignettes, short scenarios everyone rates, are another way to calibrate scale use. Practitioners disagree on standardizing scores within each country. It removes response style, but it also removes any real difference between countries, so decide deliberately rather than by default.
A practical compromise: publish cross-country averages only for the items that passed invariance testing, and keep the rest as within-country measures.
Translate the experience, not just the words
In English, "I feel comfortable going the extra mile" sounds like a perfectly acceptable survey item. But when it’s literally translated into another language, it may not sound natural, or worse, sound like a question about unpaid overtime.
Many translation issues originate from the source text. It’s best to address these issues before the source text goes to the translators. This includes removing idioms, splitting double-barreled questions (e.g., "My manager recognizes and develops me." Which is 2 questions.), and replacing vague quantifiers like "often" with clearer time frames.
This process is referred to as a translatability review by survey design experts. While it may seem like a lot of work, it’s much less expensive to deal with potential translation issues before the source text is sent to translators.
You may need to clarify what you mean by "my manager." In a matrix organization, employees may have a local line manager and a project lead in another country. Make it clear whether you’re referring to the boss they formally report to or the person they take their daily work from. You can clarify this either in the survey item itself or in the survey introduction.
Otherwise, different countries will interpret this differently.
Of course, you don’t want to radically change survey questions so that they’re no longer comparable. The goal is to keep the underlying construct consistent while making sure the question is clear.
Back-translation is a popular method for ensuring that the translated version closely matches the original one. That said, back-translation may encourage stiff, literal translations since they back-translate more neatly. Research on survey methods shows that while back-translations catch some issues, they don’t catch all.
A growing number of survey methodologists prefer a committee approach to translation. In this method, translators provide parallel translations, which are then reviewed during a translation committee meeting. An adjudicator makes final decisions on the translation’s wording.
The finalized version is then pretested with a target audience. Translation decisions are documented throughout this process.
Provide local reviewers with the full context of each question (offer a paragraph or two that tells them what the goal of this section is). Ask reviewers to think about what employees would assume you’re asking them, not whether the grammar sounds right. If you can, also include a small pilot group to review your pre-tests and tell you how they arrived at their responses and whether any words caused them to question their response.
When translating a survey, pay equal attention to the translation of the response scale options. For example, the difference between "agree" and "strongly agree" may not be perceived the same in all languages. Also, some languages may not have a word for a suitable neutral midpoint.
If you use a translated response scale that sounds too emphatic in that language, respondents may shy away from those options.
If you’re conducting a survey in countries where multiple languages are spoken or even in offices where English is the working language, consider offering respondents a choice between language versions. You can then track which language respondents chose. There is some research on bilingual respondents that suggests that the language the respondents are presented with impacts their responses.
The same employee may answer differently if they’re given a questionnaire in English vs. their first language.
Maintain a version-controlled document of the finalized wording in different languages. When you make changes to a survey item, note which past responses (e.g., 2022, 2023, 2024) the new source text will still be comparable to.
Make it safe to give an honest answer
Even if you promise anonymity, your employees may not feel safe giving an honest answer.
For example, if you have a team of 4 people, it will be obvious who submitted those concerns from last week’s survey.
The easy solution is to set a minimum team size for each survey report.
But what if a manager only has a department of 9 people and a sub-team of 5?
You don’t want to leave 4 employees exposed.
Applying multiple demographic filters like location, tenure, or gender can create the same problem.
Before launching your survey, test your reporting filters to ensure they don’t compromise employee anonymity.
While minimum team sizes are important for survey results, they’re also important for comments.
For example, if an employee leaves a comment about a specific incident, that comment may be linked back to them even if there are a lot of survey respondents.
Generally, it’s better to combine smaller teams into larger reporting groups, so people don’t get easily identified.
If you’re conducting a global survey, there are other considerations to keep in mind when protecting employee anonymity.
You may have small country offices that don’t surpass your threshold for survey respondents. In that case, you may need to include that country in a regional report.
Applying a language filter may identify a single employee. For instance, if the only Portuguese-speaking employee works at a German site, a filtered report may identify them.
Similarly, if a comment is written in a language other than the majority language, that comment will stand out.
Even if you translate the comment, employees may be identifiable.
Take a close look at your language and nationality filters the same way you’d look at your demographic filters.
According to years of employee voice research, fear of negative consequences is a factor that keeps employees from speaking up at work.
As Amy C. Edmondson writes in The Fearless Organization, people look to leaders to see how they should act when someone points out a problem.
If previously there was a "who wrote this?!" reaction to a survey from the year before, that may compromise future anonymity statements.
This is especially true in high power-distance countries, where employees may assume leaders will look for the source unless they’ve seen evidence to the contrary.
Your anonymity statement may be the same across the board, but the proof people need to believe it may vary.
While your survey provider may take steps to protect access to employee answers, it’s important that local leaders also help protect employee perception of this invitation.
Make sure people know who will see the results, what the minimum group size is before results are reported, and how written comments will be handled (and who will be responsible for translating them).
If the local HR person is responsible for translating verbatim comments in a small office, they may recognize who wrote the comment.
To avoid this, consider having these comments translated by a person outside the office.
In addition, avoid asking managers to "oversee" employees while they complete the survey.
The same goes for asking employees to complete their surveys at kiosks within their supervisor’s line of sight.
While these may boost participation in the short term, they’ll compromise the integrity of your survey results.
Early on in the survey design process, consider local requirements that impact your survey timeline.
For instance, under privacy rules in Europe, employee consent may not be considered a strong legal basis for survey participation, due to the power imbalance between employees and employers. This is one reason why many employers in Europe look to other legal grounds.
Depending on the country and nature of the survey, even works councils or employee representatives may have consultation or co-determination rights when it comes to survey tools.
For example, in Germany, works councils can often be involved in discussions around implementation because of the possibility that employees will be monitored.
In addition, there may be restrictions on transferring employee data across countries.
To navigate all these nuances, involve your privacy experts and local legal teams to review your survey plan instead of applying a single, global approach.
Map out your timeline in reverse, starting from the anticipated launch date.
Since works council discussions may involve issues like minimum reporting group sizes or demographic filters, you’ll want to make sure these items are settled before finalizing your language translations.
Give every location a fair chance to take part
It’s easy to pick a launch date for your global employee survey. It may not be the best decision from the perspective of getting high participation rates across your employee base.
Your local HR teams can help you identify key periods or events that may impact survey participation, such as Ramadan, Lunar New Year, Golden Week, Diwali, vacation periods, or site shutdowns.
You can also ask about less obvious events that may impact survey participation such as a local restructuring announcement, bonus communications, or fiscal year-end.
For sites with primarily deskless employees, it’s important to consider how employees can easily access the survey before you distribute the invitation.
For instance, can you simply distribute a QR code on a poster in the break room? Will that work for all sites or will you need to provide a shared kiosk?
If there is a shared kiosk, it’s important to make sure employees can log out and make the default language the appropriate language for that site. If needed, you can distribute a link that employees can easily access on their own phone.
Consider shift patterns as carefully as time zones.
If you send a reminder email at 9 a.m. at your head office, it may be the middle of the night for one of your sites and peak hours for another.
It may be worth ensuring that the survey window is open for at least a full shift rotation for sites with night-shift workers or rotating shift workers to ensure all shifts have a fair chance to participate.
Keep in mind that you want the survey to be voluntary participation, but that you’d also like people to have dedicated time to complete the survey. In other words, you want them to complete this on paid time.
Research on survey methods generally show that people are more likely to quit longer survey. This would suggest that a short, core survey is better for a global workforce than a long, comprehensive annual survey.
At the same time, you’ll want to keep an eye on response rates just as attentively as you keep an eye on survey scores.
For instance, if you notice a very high response rate from one office, but a much lower response rate from a particular plant, you know that the plant’s survey scores are only representative of the people who chose to respond - and they may not be the least engaged employees at the plant.
To boost participation across different regions, you can allow regional leaders to choose when they send reminders within a shared survey window. A local contact can help employees understand the why the survey is important and answer practical questions about how to complete the survey.
That said, you don’t want local leaders to chase down specific employees.
Be mindful if you decide to use live, leader-boards of response rates by manager. In high power-distance countries, this can quickly lead to pressure on individual employees.
Finally, keep an eye out for suspiciously high response rates.
If a site with a strong hierarchical structure has a near 100% participation rate, but the answers given are all uniformly positive responses, it may be worth a quiet conversation about how the survey was promoted.
Compare places without turning the results into a league table
Country rankings look nice and tidy on a dashboard. But what do you do when you have to account for different languages, response styles, and the demographics of your respondents?
First, compare each of your locations to themselves over different periods of time. If your manager support scores decrease, but the wording of your survey, the language version used, and the demographics of your respondents stay relatively consistent, then you know there’s a local team issue to investigate. On the other hand, if there was a reorganization or a new site that caused the demographics of your respondents to change, you’ll want to keep that in mind when you’re interpreting your results.
Next, you can compare the relative strengths of different sub-categories within each of your locations. For instance, in one location you may have high ratings for people’s coworkers and low ratings for workload. Since the order of items within a country isn’t largely impacted by response style bias, this is one of the most reliable comparisons you can make across countries.
Is "workload" Tokyo’s weakest area? Is it also Brazil’s weakest area?
This also helps you decide where to dedicate resources. If you have a shared weakness, it may point to the need for a global fix such as a new staffing model or rollout of a new tool. On the other hand, if there is a weakness unique to a specific location, that may require a local fix.
This kind of insight is difficult to glean from a simple league table.
External benchmarks may also help you compare your countries if those external benchmarks focus on a similar workforce and use a comparable measure. Since external benchmarks can be country-specific, they can limit response style bias on a local level - which is why they may be better to use than a single global norm. In any case, your country-specific norms are something you should consider overall when making decisions.
Of course, it’s important to consider your data comments in addition to your numerical data. But keep in mind that a sentiment analysis tool may not evaluate all languages or all indirect criticisms equally. For instance, a comment that’s phrased as "It might be worth considering other approaches" may be scored as a neutral or positive comment by the tool when it is actually a clear complaint.
Have a reviewer that is familiar with your language and workplace review all themes before you rely on translated comments to drive your decisions.
If your survey results surprise you, reach out to your local team to understand what else is happening at the time of the survey. You don’t need to explain away a low score, but you do need to know what your employees are answering questions about.
Finally, if you do present your locations side by side, be sure to present the response rate and the language in which the survey was completed alongside each score. This way, your leaders can view each number in its proper context, rather than hearing all the caveats at the beginning in a methodology slide and forgetting them by the time they view the dashboard.
Sparkbay allows you to customize the wording of your survey by location while still asking the questions you need to get a global view of employee engagement. This way, your local teams can quickly spot any phrases that don’t translate well before employees receive the survey. You can also customize the wording on your dashboard views, so the labels are easy for local leaders to understand.
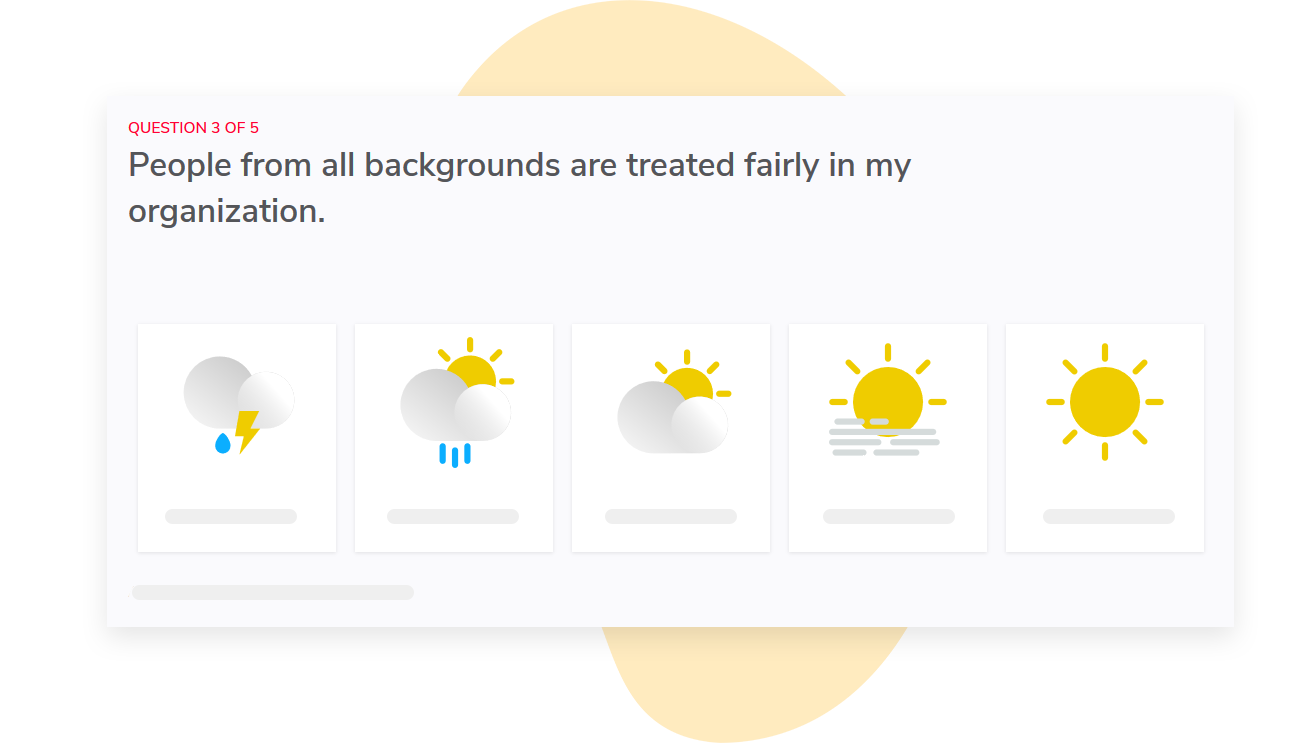
Our engagement score is based on a scale of 10. But instead of simply showing you the average engagement score of each country, our tool lets you drill down to see how different groups within a country compare, highlighting internal differences within your location. You can also customize the content of your dashboard, so your leaders can easily make relevant comparisons based on your organization’s structure, instead of looking at a default ranking.
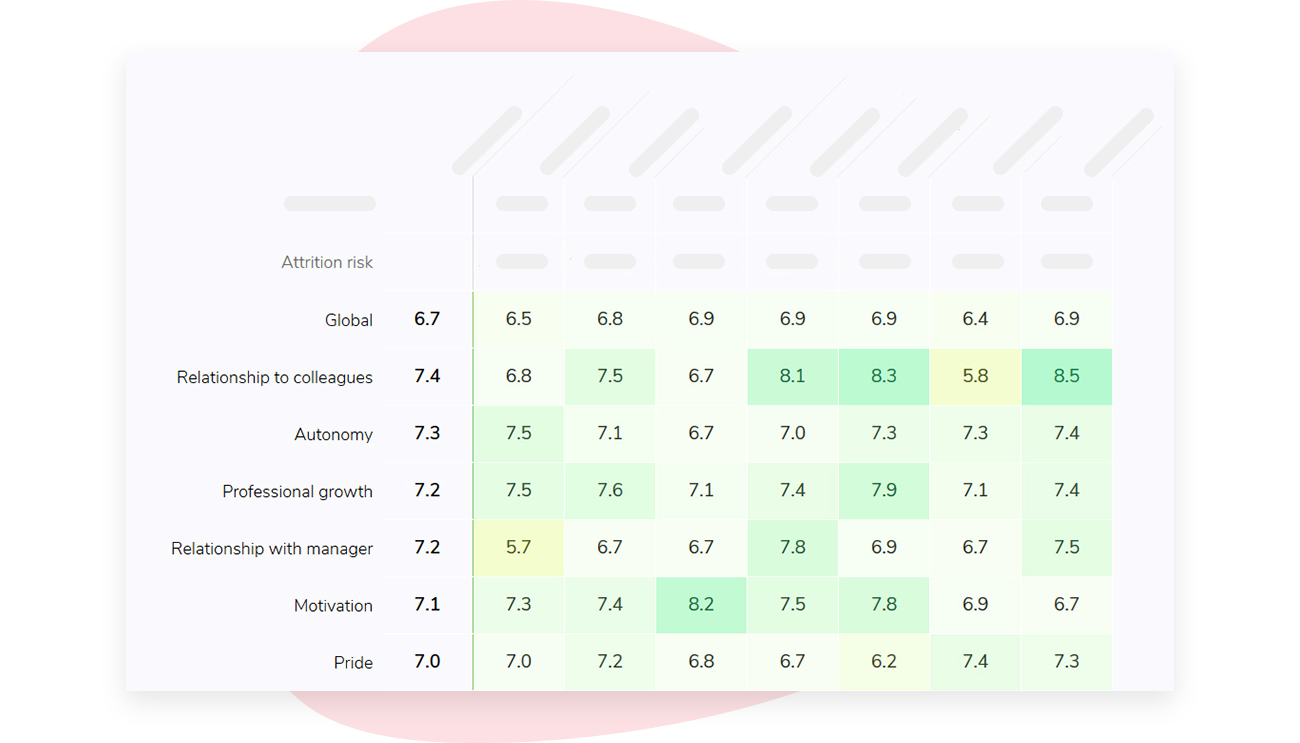
We also limit the visibility of small groups. Results from groups with fewer responses than your set minimum (5 by default) are not displayed. In a large organization, we can automatically link report access to the org structure, so each manager only has access to reports on their teams.
If you’re interested in learning how Sparkbay can help you build a more engaged workforce, you can click here for a demo.
Let local teams act on what they learn
A country score might be the starting point of a discussion, but it’s not always appropriate for head office to decide on the solution without input from the local team.
Once you’ve shared the results privately with local leaders, give them time to review the results and compare them to what their employees hear or see. Provide teams with an opportunity to identify areas where the survey results are aligned with their reality, and where there are questions.
Ask local teams what they want to do. Do their employees want a team discussion about workload? Or would follow-up conversations privately with local staff be a better option for them to share their concerns?
This way, you can set a standard expectation of taking action without requiring each of your sites to hold the same type of meeting.
Remember the differences we discussed earlier when it comes to Meyer’s scales of cultural differences. For example, in a hierarchical office, a manager may not receive answers to the question, "what should we fix?" in an open team meeting. Participants may feel it’s presumptuous to share their opinions in this way.
Smaller groups, a trusted peer facilitator, or even written submissions collected in advance may be better ways to get these insights.
If all of these considerations feel overwhelming in the context of a global survey, you don’t have to address every possible nuance right away. Start by taking a closer look at the questions that are most likely to have adjusted meanings, the specific population groups most likely to be identified, and where leadership will actually use comparisons.
Most importantly, share what happened with employees after they participated in the survey. Survey research and employee voice research both show that people are less likely to share their opinions if they don’t witness any response to them.
Provide each local team with an opportunity to report back on the specific issues they addressed, what actions they took, and what questions remain. Then in your follow-up surveys, include questions about these issues (using the same wording from the initial survey) to see if there’s been any change based on your follow-up efforts.
Finally, be careful about giving too much credit to local teams for a positive rebound. If there previously was an unusually low survey score, it may be a natural rebound to the location’s normal score. Use longer-term trend data to assess the success of an action.
If you’re interested in learning how Sparkbay can help you build a more engaged workforce, you can click here for a demo.