
Most "surprise" resignations were only surprising to the people who weren't connecting the dots
Your superstar project lead quits, and her manager insists that nobody saw it coming.
Over the past two quarters, she lost an internal job posting to an external hire, stopped volunteering for cross-team projects, and twice raised the issue of a promotion.
Both times, her manager took the case into calibration. Both times, it stalled.
None of this means that she was actively interviewing elsewhere, and it's unfair to treat these signs as proof.
But taken together, they form a pattern that should've prompted a real conversation months before the resignation letter arrived.
You almost certainly hold all of these signals within your organization: the requisition outcome, the calibration result, the drop in cross-team work, the unresolved promotion ask.
They're just stored in different systems, managed by different teams, and reviewed on different cycles, so they're not easily viewed side by side.
The most useful signals are those that represent a change in a person's or team's behavior relative to their own baseline, when interpreted in the right context. Enterprise-wide averages or generic "risk factor" lists drown out these insights.
In this guide, you'll learn which engagement signals are truly helpful, which engagement signals are not that helpful, common pitfalls when developing prediction models using these signals, and how to act on your insights while respecting employee privacy.
Turning engagement survey data into early attrition warnings leadership will fund
- Exit interviews only tell you what happened way too late
- Start with the data you already have
- Treat changes in behavior as questions, not proof
- Interpret your survey trends, even when you can't identify respondents
- Check the career and pay story behind the score
- Build a model people can question
- Don't turn prediction into surveillance
Exit interviews only tell you what happened way too late
Exit interviews are conducted well after an employee has made the decision to leave. Since the employee wants to keep their options open by securing a good reference, they may not be fully honest during the exit interview.
For instance, they may sugarcoat their true reasons for leaving by saying, "A great opportunity came up", when in reality, they couldn't work for their manager any longer.
According to research from Gallup, replacing an employee usually costs an organization between one-half to two times the employee's annual pay.
Why such a big range? There are a lot of factors that influence replacement costs including ramp time, labor-market scarcity, and the amount of money it costs to external hire a replacement.
It's important for organizations to evaluate the replacement cost by job family, rather than using one enterprise-wide number. Organizations should also consider how long a replacement takes to become productive in that job family.
It's also worth considering the fact that hiring someone externally to fill the role often means paying a market premium and taking more time to get that person up to speed than if the organization had hired someone internally.
There are also one-off costs that arise that aren't considered when organizations calculate replacement costs. For example, an important employee's departure could also impact client relationships if they were the main point of contact.
And departures don't always happen in isolation. People tend to follow a manager they respect out of the door, or they depart soon after the colleague that hired them leaves.
In other words, the timing of these departures matters.
Three employees leaving within a span of eight weeks from the same team is different from three employees leaving over the course of an entire year, even though that would count as three in the annual turnover numbers.
Calculating a 12-month rolling attrition rate can smooth over areas of concern and make it less useful for spotting potential problems.
Instead, you want to monitor where people are leaving on a monthly basis, by team and by tenure band, and check for spikes compared to historical data within each category.
Instead of asking "Are we tracking our turnover data correctly?", ask yourself "Were there any signs we could have picked up on 3-6 months earlier that would have encouraged us to have an earlier conversation?"
This is the real purpose of using an attrition prediction tool - to help managers and leaders focus their attention and efforts in the right place by identifying "at risk" conditions and populations.
This means your model's prediction horizon should match your ability to respond.
If it takes you one full compensation cycle to fix pay issues, or several months to facilitate internal moves, a model that identifies people most likely to leave in the next 30 days won't be useful.
Start with the data you already have
You don't necessarily need new data. You need to understand what existing data sources you have can accurately represent what happened in the past.
This is because the biggest data quality issues often occur when organisations overwrite historical data.
For example, your HR teams collect data in "effective dated" fields, such as:
-Grade
-Manager
-Location
-Job code/titles
-Compensation ratio
These fields are important, but the key question is: Can you view the values for these fields as of a specific date in the past, or can you only view the current value?
Ideally, your HRIS can capture what the value was at a specific date.
If not, then you may need to use audit logs or regularly scheduled snapshots to reconstruct the data in a format that can be used for modeling.
This is especially important during organizational or departmental changes.
For example, a reorganization may change the manager ID for hundreds of people overnight.
If you don't account for this, all of a sudden your manager change variable has a massive amount of noise from one-off organizational changes.
It's essential to understand and identify your variables before you merge data sources.
Different business units may keep track of the same event in different ways.
For example, one business unit may consider a change in grade a promotion.
Another business unit may keep track of a change in title separate from a change in salary that often happens at the same time.
Meanwhile, another business unit may consider an internal transfer separately from rehire.
The same idea applies to distinguishing exit types.
Business units may define and distinguish voluntary and involuntary turnover in different ways. Organizational changes may confuse this further.
Why is this important?
Because your outcome label depends on this data, whether it's "voluntary turnover" or "regrettable turnover".
On top of this, "regrettable" labels can introduce bias. Managers are likely to apply these labels retrospectively and inconsistently based on how well or poorly the exited employees' relationship with the company went.
Are retirements, non-renewed fixed term contracts, or internal transfers considered turnover or not?
Generally speaking, most organizations consider internal transfers a retention win. Including them as turnover would penalize managers who successfully export talent to the rest of the business.
You may also need to segment your baselines.
Is the "normal" turnover rate for a 3-year specialist very different from the turnover rate for a graduate hire that's been on the job for six months? And how different are both of those baselines from the enterprise average baseline rate of turnover?
If you're ready to get started on managing your data, great!
We recommend starting with a specific population that has enough history of regrettable turnover to support a modeling project.
Next, work to reconstruct what the data looked like at specific points in time prior to each of those exits.
How many exits are needed in order to start an effective predictive modeling project?
A common rule of thumb from standard regression practice is that you need about ten outcome events per variable in your model.
This means that if you're working with data from one job family that had 40 instances of regrettable exit over a 3-year period, your data can support about 4 predictor variables (not the 50 random fields you might have sitting in your HRIS). Make sure you choose those four variables carefully.
If your data set falls below this threshold, we recommend focusing on descriptive analyses and comparisons between cohorts.
Finally, if your model simply doesn't work once you go live, consider the possibility of data leakage.
Fields often subject to data leakage include fields filled in during the offboarding process, exit reason codes, and final performance ratings or survey data that go into the system after an employee has given notice.
If you're going to include survey data, please follow this most important rule:
Don't join your anonymous survey results to your non-anonymous HR data at a level of granularity that you aren't allowed to report on, such as the team level.
Here's why: Suppose you have access to the parent unit and all of its sub-teams except one.
You can easily figure out the anonymous results of the sub-team you don't have access to simply by subtracting from the rest.
Treat changes in behavior as questions, not proof
If you notice a drop in engagement, it's worth paying attention to.
But it could just as easily mean the end of a grueling project, a new caregiving responsibility, or a manager who's stopped handing out stretch assignments.
This is why comparing a person's engagement level to their historical engagement level is more helpful than an absolute metric. What's a red flag for one employee may be a normal quarter for another.
You'll also notice stronger signals after talent events that went badly.
For example, being passed over for an internal role, especially when the role goes to an external hire, is a jarring event.
Others include being held back through calibration or not presenting a promised development plan.
This conforms to the "unfolding model" of voluntary turnover that Thomas Lee and Terence Mitchell developed. Their research found that many employees quit after a specific jarring event (or "shock") rather than as a result of slowly growing job dissatisfaction.
What does this mean for your organization?
Well, many of these shocks show up in your organization's systems since they are decisions your organization made.
This means it's a legitimate reason for a manager to check in with someone, but it isn't a reason to label someone as a flight risk.
Another important consideration is that these signals diminish over time.
For example, if someone applies for an internal role and gets rejected, it's a good idea to proactively check in with them over the next few weeks (or potentially months). After that, however, the predictive power of that item fades, especially if they've since moved roles or been promoted.
On the topic of collaboration analytics, it's important to be skeptical.
Metrics like meeting load and message volume are noisy metrics that are only weakly tied to engagement and commitment. What's more, they systematically penalize the people you hired to do focused deep work.
Similarly, if an employee's network centrality score goes down, that's expected if their role changes substantially. This in and of itself doesn't indicate an intention to leave.
There are also suggestions for signals that simply aren't appropriate for individual-level models.
Take single vacation days, for instance. People take them for medical appointments, childcare, and a dozen other reasons.
Plus, scouring calendars for signs of job hunting is a privacy invasion. If employees find out, the damage to trust and your employer brand may outweigh the utility of your prediction model.
The same goes for optional activities or employee resource groups (ERGs). People join these for many reasons and they're optional for a reason.
What can managers legitimately flag to HR? Work-related changes, of course.
For example, has an employee stopped asking for feedback? Have they applied for a role they once said they wanted? Have they said in two consecutive check-ins that they can't see what's next for them?
Of course, managers should also take these changes in behavior in context. Have you recently experienced a change in managers? Did someone just have two cancelled career conversations in a row?
Have they been overloaded with work for an extended period?
Interpret your survey trends, even when you can't identify respondents
If you have a small team, especially one that is right at the anonymity threshold, a low pulse survey result may just be a blip.
Look for a change that sticks around for a pulse survey or two or takes your team outside of its historical range before you take action.
When you do have a sustained change, follow the change from your engagement score down to your individual survey items.
Items related to growth, manager support, and intent-to-stay may change before your overall engagement score changes.
It's also smart to look beyond the average results.
Suppose the average engagement score for your team stays the same, but the standard deviation drastically increases. This may mean your team has divided into two camps: a satisfied camp and a dissatisfied camp (which is at risk of leaving).
While useful to look at alongside engagement score, your eNPS number hides more than it reveals. It's entirely possible that employees love their jobs, but they don't see themselves at the company for the long haul.
If you want to use survey items as pre-warning indicators, validate your data against your company's history.
Compare each survey item's scores with the regretted attrition your teams saw over the following six months. Survey items that don't align with actual attrition within your organization shouldn't be automatically prioritized just because a provider framework says they should.
Pay attention to your participation rates as well.
Suppose your team notices the participation rate for another team drops over the course of several months, while other teams remain consistent? This may signify that people no longer believe their voices will lead to change. This is a potential red flag sign on its own.
Albert O. Hirschman's Exit, Voice, and Loyalty provides a helpful guide. Hirschman suggested that dissatisfied members either use their voice or leave the organization. So when members no longer believe their voice matters, they're more likely to leave.
In other words, if you notice a sudden drop in participation in surveys from a specific team, this may be a sign that members of that team are looking for other jobs.
On the other hand, a dip may be a timing issue (e.g., a pulse survey that landed at the end of the quarter). Take a look at your calendar before jumping to conclusions.
And never chase down individual non-respondents in an anonymous survey.
Pay particular attention to growth items. Employees usually voice concerns about their career development long before they express an interest in leaving.
In fact, Gallup research shows that relatively few employees strongly agree that someone at work encourages their development. Treat this item as a pre-warning sign that your people need more support.
Use your open-text responses to add context to your survey numbers.
If several teams independently mention issues like external hires landing promotions or calibration decisions that were never explained, it's probably a problem with your talent processes.
Of course, never use text analytics to try to identify who wrote what or develop a "likelihood of quitting" score.
Check the career and pay story behind the score
People often quit a job they like when they no longer see a future for themselves.
So what does it mean when someone hasn't been promoted for a while?
Is that a warning sign for an early career employee? What about a senior specialist, three years in grade?
It depends. Look for mismatches. Have they been doing higher level work for an extended period of time with no change in grade?
Are they applying for other jobs internally? Did they recently have a career conversation with their manager that led nowhere?
Pay signals are worth digging into, as well.
Are your external hires coming in to similar roles at a higher pay? For tenured employees, this pay inversion can lead to resentment.
Has someone's scope increased substantially in between compensation cycles and their pay never caught up?
One large survey of employees who quit found that roughly six in ten employees cited low pay as a reason for their departure while roughly six in ten cited too few advancement opportunities (respondents could choose more than one option).
If an employee says they're leaving "just for the money" consider whether there's a larger career progression problem at play.
Receiving an offer may have simply triggered action on a much bigger career issue.
How do you handle this?
While a counter-offer solves the pay problem, it doesn't solve the career problem. This is one reason counter-offers so often only delay departures.
Incorporate manager history into your analysis, as well.
Gallup research suggests that managers drive 70% of the variance in employee engagement across teams.
Has an employee had several manager changes in a short period of time?
In other words, are they on their third manager in 18 months? Each time their champion changes. And there's a good chance no one in the calibration room knows their work well enough to champion them.
Pay attention to what happens after a close colleague or manager leaves.
Research shows that turnover affects the people who remain, making this a critical window for follow-on exits.
Check in with people who remain to see how their work and long-term prospects have changed.
Finally, avoid making generic "danger zones" (e.g., 90 days, 1 year) for departure.
Map out your risk based on tenure for your specific workforce broken down by role and location, and include contract dates in your analysis.
You may find that risk shoots up when the organization can no longer claw back sign-on bonuses, there's an equity vesting cliff, or a retention award expires.
Build a model people can question
A well-thought-out, simple model is usually more helpful than a complex, black-box model that you can't explain to your HRBP.
Logistic regression allows you to estimate the probability that an employee will leave within a defined time window, e.g. the next six months.
Alternatively, survival analysis allows you to focus on the time until an employee leaves. It also takes into account employees who were still employed at the time your data stopped recording.
With survival analysis, you can model time-varying covariates - variables that change over time. For instance, it can take into account a pay gap that started after an employee had already been in the organization for some time. This is often much more realistic than other models for most HR questions.
Machine learning models such as gradient boosting or random forests can also capture interactions that a linear model might miss. For example, the impact of stagnation in the role on churn may only become significant once there's also a pay gap.
These potential improvements should be benchmarked against the simple models to understand how much they're actually improving predictive performance, especially after you've done your data leakage checks.
Be aware that class imbalance can cause problems for your project.
Since most people will remain in an organization over a short period of time, a model that predicts "stay" for everyone will have a deceptively high accuracy, despite not identifying any churn cases.
Moreover, even a useful model will generate a lot of false positives, because the churn base rate will be low (low "precision" in the model).
Make sure you report (and understand) metrics like precision and recall. Also check that your model is well calibrated i.e. a 30% risk score actually means there's roughly a 30% chance of leaving.
Additionally, consider what the output means for the users' workload. How many people will a manager need to speak to in order to find one person they would realistically be able to retain?
Avoid defaulting to arbitrary flag score thresholds like 0.5: choose a threshold based on capacity.
If your HRBPs can only realistically follow up on 20 cases per quarter for a specific business unit, choose a threshold that flags the top 20 and then check how many regrettable exits are caught within that group. Otherwise, they'll ignore the tool altogether.
Validate your model on a later time period than your training data - using a random split is not only flattering to the model, but also unrealistic.
Tools like SHAP values help users understand why specific features caused their predicted risk scores to go up or down. But they shouldn't be interpreted as explanations for what caused churn.
For example, the model might highly weight the presence of a pay gap, but that doesn't mean you know whether giving that individual a raise would've changed their decision to leave.
Retrain your model after major changes to your organization (e.g. reorganizations, compensation redesigns, massive hiring waves) since this can invalidate your features.
Provide a way for HRBPs to challenge or interrogate output. If the model suddenly flags 80% of employees in a certain location after a policy change, perhaps it's time to look into the policy instead of putting all those employees under the microscope.
There is genuine disagreement among practitioners about whether individual risk scores should be shared with line managers at all.
Some prefer to keep them within the HR department and only share team-level conditions with managers.
Don't turn prediction into surveillance
Before you introduce any risk scoring, let employees know what data will and won't be used for the workforce analysis.
It's hard to build trust. It's even harder to rebuild trust if your employees find out you're conducting analysis behind their backs.
Apply data minimization techniques.
Just because you have access to collaboration metadata (e.g. number of messages sent after-hours) doesn't mean it's fair to include this in an individual risk score.
Avoid adding data points like vacation patterns, membership to private WhatsApp groups, or responses to anonymous surveys to an individual risk profile.
Document who can access the analysis, how long it'll be stored for, and what decisions it'll and won't be used for.
Loop in your privacy, legal, and if applicable, employee representatives early on so they can influence the process while there's still time to make changes.
In some European markets, this may mean a works council consultation and data protection impact assessment.
The rules for profiling differ in different countries. While it may be tempting to design a global system, be sure to check how it measures up in various countries before implementing it around the world.
Test for bias across different employee groups.
Historical attrition data may carry the biases of past pay and promotion decisions. Removing protected characteristics from your data sets doesn't necessarily solve this problem since there may be proxy variables that reintroduce the same bias (e.g. part-time status, location, a career break for family, etc.).
Guard against self-fulfilling prophecies.
If your system flags an employee and this causes your organization to quietly withhold opportunities (e.g. interesting work) on the assumption they'll soon leave, you've created a self-fulfilling prophecy.
Cathy O'Neil discusses this problem in Weapons of Math Destruction. Opaque scoring systems create feedback loops where the outcome of the model impacts the outcome it's measured against. If your model causes people to leave (which it predicted), it makes itself look more accurate!
To guard against this, companies should ensure that receiving a flag for potential flight risk should only trigger an offer of support (e.g. career conversation, pay review, access to internal roles) and not be fed into staffing, succession, or promotion decisions.
You want to help employees, not limit their opportunities using a prediction.
For your attrition analysis, the most helpful survey signal is change that sticks around for multiple pulses.
Since Sparkbay runs pulse surveys regularly, you'll be able to see how your team's feelings about their future at your company change over the course of weeks instead of months.
You'll be able to configure the survey (including the wording of the questions) to include growth, manager, and intent-to-stay items.
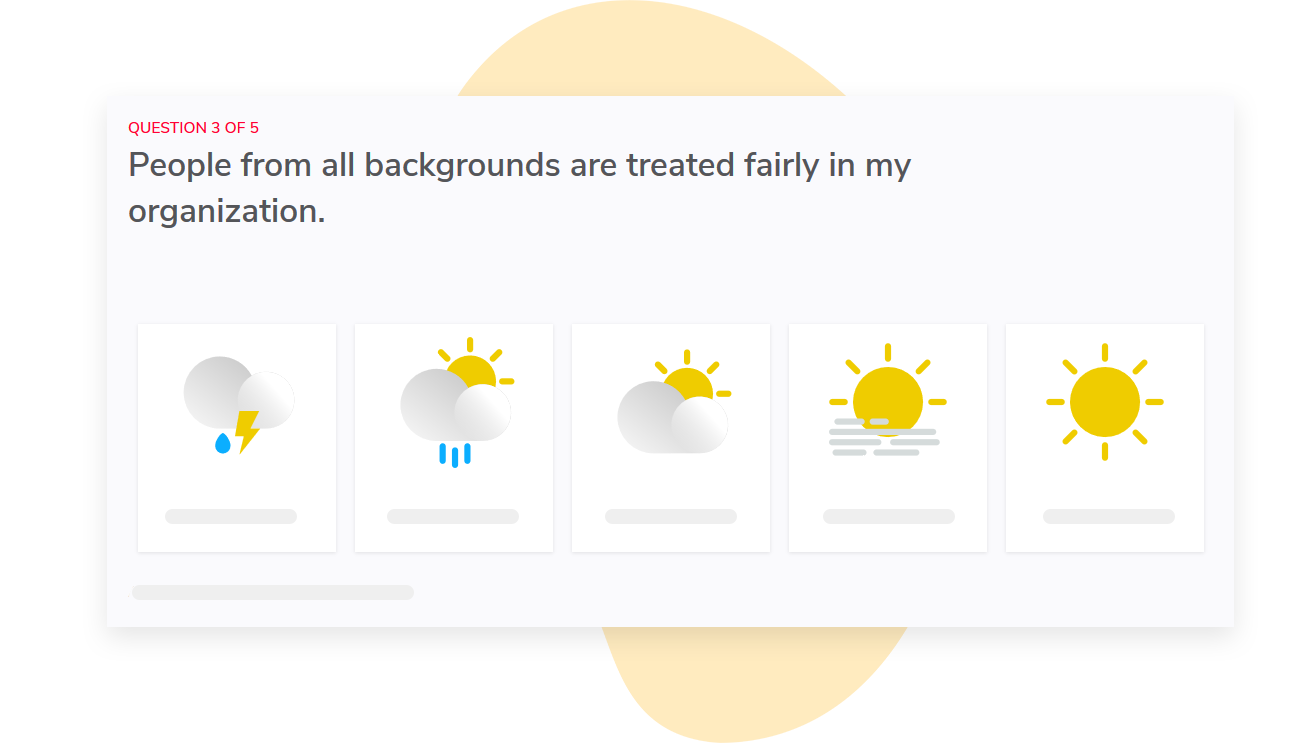
Your main metric is your engagement score out of 10.
You'll be able to see how that score changes over time, and drill deeper to understand which items caused the change. This way, a single dip in your engagement score isn't a condemnation of your team.
You'll also be able to compare your results across departments and teams.
If your growth scores are dropping across a specific department, while the rest of the organization remains the same, you can start the conversation with your HR team about what's changed (e.g. new manager, stalled promotion cycle, reorganization).
We've designed the text and content of our dashboards to be customizable, so you can tailor it to fit how your HRBPs work.
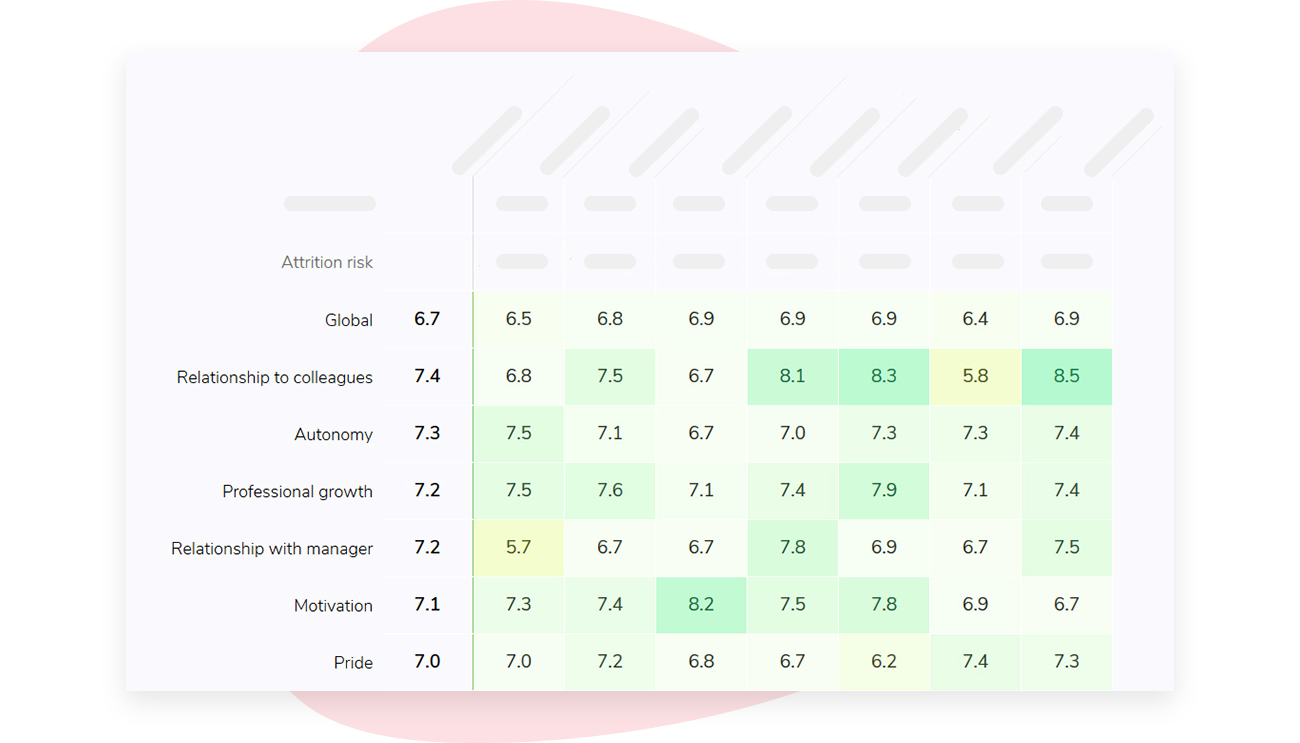
With our system, access to reports is automatically mapped to your org hierarchy, so each manager and director only sees the results for their teams.
Results for teams smaller than the minimum number of responses (5 by default, but you can customize this setting) are automatically hidden to ensure anonymity.
If you're interested in learning how Sparkbay can help you build a more engaged workforce, you can click here for a demo.
Turn a warning into a better conversation
A risk score should not replace managers' conversations with their direct reports.
Instead, it should help HR leaders decide where to prioritize a conversation, and in some cases, what issues to look for.
Start with what you can control.
If your growth scores are dropping, ask managers when they last had a career conversation with each of their direct reports where they mapped out specific roles, timelines, and development gaps.
If your pay scores are dropping because your compensation package is lagging behind comparable roles or the amount recent hires are earning, commit to a fix or at least a communicated plan, and stop asking people to "stick it out".
Stay interviews work best when they focus on an employee's actual work experience.
Ask them what they want more of, what tasks they're tired of dealing with, and what would make them consider responding to a recruiter.
Remain open to surprising answers, as these are often the most helpful.
Avoid introducing a stay interview by referencing a model or risk flags.
A line like "The data shows you might leave" shuts down honest conversations and makes employees feel like they're being graded. Instead, managers should conduct these routine "stay interviews" with everyone on their team.
Research by Gallup shows that 42% of voluntary leavers say their manager or organization could have done something to keep them.
Don't wait until exit interviews to put your best foot forward.
Deliver short, concrete lists of actions your managers can take.
Sometimes that action is a pay review. Other times it's a clear path to a specific role or real changes to workload.
Some fixes are structural, like redesigning job architecture or lifting a promotion freeze. These are things HR needs to own instead of pushing back on line managers.
Then, evaluate whether your retention efforts are working.
Are you tracking regrettable exits alongside your internal moves, pay adjustments, and team survey trends?
If possible, stagger the rollout of your program across comparable populations so you have a pre-established comparison group.
This prevents you from crediting your program for everything when most people would've stayed regardless.
Track whether follow-up actions actually happen.
If employees who were flagged did not receive a conversation, a pay review, or a new opportunity within the agreed-upon time frame, then a flat attrition rate doesn't mean your risk model failed. It means your follow-up failed.
You don't need an enterprise-wide program from day one.
Choose a population, ensure their data history is properly rebuilt, and create an upfront agreement about who will act and how quickly they'll act when a signal fires.
If you're interested in learning how Sparkbay can help you build a more engaged workforce, you can click here for a demo.