
Suppose your engineering manager stops by to let you know that a surprising developer you didn't think would leave just submitted their notice.
As the CTO asks if there was any warning, you think back to the last pulse survey results that came in from Maya's team. You remember that one score on Maya's team came back a little low, but since the rest of her team's results were steady, no one followed up.
You also know that if that pulse survey was anonymous (as it should be) there's no way to know which score was Maya's.
Now, you've got to figure out a way to predict these kinds of resignations ahead of time.
As an HR leader, you've got two options: You can develop an in-house attrition prediction model using your employee records, or you can figure out how to get more out of the engagement data you're already collecting.
Sure, a custom attrition prediction model might help you identify patterns that your current surveys miss. That said, building a custom model requires a significant investment in data infrastructure, validation, and maintenance.
On the other hand, survey results are data you can use right away. The only problem is if the data is anonymous (which it should be) your best bet is to identify a team at risk of attrition, not a specific individual.
Here's a breakdown of how each approach differs in terms of cost, blind spots, and privacy risks, and how you might decide which is best for your organization's needs and managers' usability.
Custom attrition models versus engagement-based retention analytics
- How much does it cost when an employee quits?
- What your engagement data can tell you
- Why is it tempting to develop a custom attrition model?
- What does it take to develop and maintain an effective attrition prediction model?
- Where surveys fall short
- How do the two approaches compare?
- Ensure your predictive model is used for good
- How Sparkbay can help you identify retention risks in your team's feedback
- Choose a starting point you can support
How much does it cost when an employee quits?
At this point, you're probably over the recruiter fee.
Consider the hiccups in productivity for the teams affected by Maya's departure. You've got to think about how much of Maya's open work falls onto the plates of other team members who are already managing a full workload. Then, there's the time that Maya's manager has to spend interviewing candidates.
What about the three people Maya onboarded who now have to manage without her?
The cost of replacing an employee can vary dramatically depending on their role within the company. Some estimates say it can take several months' pay to replace someone while other estimates claim it takes over a year when you account for lost productivity and the time it takes to fill the position. We should all take these numbers with a grain of salt.
Most of the variance comes from things like undocumented knowledge and the amount of time it takes for an employee to come up to speed - factors that companies struggle to account for in financial models.
There's also a troubling second-order cost. What if Maya's departure signals to other employees that "there's no path here for me." And that gives them permission to update their resume and start interviewing? Perhaps Maya's colleague already had their own issues and concerns for all sorts of reasons and were waiting to see what Maya would do before making a decision for themselves.
Exit interviews are often not a rich source of information. They are a lagging indicator at best, and oftentimes an overly sanitized version of events. People on their way out don't often want to risk a future reference by bad-mouthing a manager.
According to Gallup, many employees who leave voluntarily say their manager or organization could have done something to keep them. That is where the most turnover is preventable. In other words, the window before an employee hands in their resignation is when the most effective interventions can take place. This window closes as soon as the employee gives their notice.
And this window closes long before a sanitized exit interview would reveal anything.
There's another side to this story. In his book The 7 Hidden Reasons Employees Leave, Leigh Branham makes a similar argument. He writes that when employees leave, they aren't doing so precipitously. Instead, they've been disengaged for some time. And there have been visible signs along the way. He also shares that most of these root causes are within a manager's remit to address.
What your engagement data can tell you
In most large organizations, the helpful signals are already there, but they exist in different systems with different rules about identifiability.
Your annual survey asks a few questions about career growth. Your pulse survey asks people whether they trust their manager. Your recognition data shows who's being recognized.
All of this is helpful. But it only presents half the picture. The other half is who feels overlooked.
This is an important piece to keep an eye on.
Similarly, your performance reviews and 1:1 notes would be helpful pieces of information for a retention analysis, but they're meant to be identifiable. You wouldn't want to compromise your anonymous survey data by putting those together.
That said, you don't want to take all of this at face value. Maybe the overall engagement score for a certain team remains the same overall, but their answers to the career opportunity question have dropped for the past 3 pulses. This may be worth looking into.
This is because composite scores are designed to even things out, so significant changes in individual questions can be washed out while people only pay attention to the overall score.
You also want to keep an eye on your response rates. If a team that used to regularly respond and often reply to surveys drops off, this may be a sign that they're starting to feel disconnected and disengaged.
Try to see whether this aligns with particular events. Did their manager change? Was there a reorganization?
Perhaps responses related to a new manager for example, are very positive the first pulse with the new manager, but by the third pulse they're less positive. Instead of taking the survey scores as gospel, use them as a prompt to engage in conversations and check whether your assumptions are correct.
When you're looking through your survey data for red flags related to growth opportunities and career paths, keep in mind that questions on whether people can see a future for themselves at this organization tend to be the most helpful. A question on satisfaction with training may not be.
Large studies, such as LinkedIn's study on workplace learning, have shown that people place a high value on learning and moving forward.
A team may very well rate their Learning and Development experience highly, but they may not see a career path for themselves. This is something people often mention when they leave.
Not every growth push factor is related to opportunities or career paths. People also stay in jobs they enjoy because of "job embeddedness."
Research affiliated with Terence Mitchell and Thomas Lee shows that people stick to their jobs because of things that "stick" them to their job like how well they fit in their job, how many ties they have to their coworkers and projects and what they think they would give up if they left.
This is useful information for when you're reviewing your data for growth opportunities.
Think back to the example of Maya's team. If the person responsible for new hires leaves, there are fewer ties for new hires on the team now even if the survey responses remain the same. Questions about belonging, support from your peers, and stability of the team may be more relevant than questions about growth opportunities.
At the same time, remember that if you're looking at an anonymous, team level result, that data only tells you how that team feels as a whole. It doesn't let you know whether any one employee (like Maya) wants to quit.
This takes us back to the awkwardness we discussed above. If the responses from Maya's team are from an anonymous pulse survey, there shouldn't be a way to tie a low response on a specific question back to Maya to single her out. If she raised concerns in an identifiable check-in, there was an opportunity for her manager to follow-up based on what she was comfortable sharing.
If a manager didn't follow up, that's a failure on their part.
Use your survey trends to prompt better questions, not to speculate on which employee might have given which responses in a survey.
You don't have to build a whole new system for looking at trends and comparison levels.
What you do need is a way to pull survey responses for specific questions and compare them from survey cycle to survey cycle, plus a way to have conversations with people who have the skills and time to have these conversations with their teams.
Why is it tempting to develop a custom attrition model?
An employee survey gives you a slice of what your employees say about their experience at work. Developing an in-house employee attrition model allows you to analyze if survey data combined with other employee data produce patterns that can predict voluntary exits from your organization.
For example, your model might examine the impact of variables like days since last promotion or lateral movement, compa-ratio, recent manager changes, tenure band, and internal applications. If you're able to collect data legally, you might also include change in commute times due to moves. Other variables may also be useful given the right assumptions and logical rationale to justify their inclusion for business, legal, and works council purposes.
This is because you may need to explain to an employee why a particular variable is being used.
Statistical techniques like logistic regression predict the probability an employee will leave within a specified time window. Survival analysis estimates when an employee is likely to leave based on their characteristics and correctly accounts for those employees who remain at a cut-off timepoint (censored observations), which naive classification models do not handle properly.
More advanced statistical techniques such as random forests and gradient boosting can capture interactions between variables. For example, an employee's lack of promotion may only become an issue after a new manager arrives. These methods, however, are less transparent and harder to explain.
Simply creating a feature importance chart may not make these models understandable to a line manager.
Which one is best?
A good choice of statistical method depends on the decision horizon and decision type you have in mind. If your HR team wants to determine whether lack of promotions is leading to employee exits for a large job family, an easily interpretable model may be more useful than a black-box, machine-learning approach.
In clinical risk prediction, researchers have compared the benefits of using flexible, machine-learning methods over well-specified regression models using routinely collected health records. These studies have generally shown only modest improvements when implementing complex models. Given that these studies typically have access to data sets with more individuals than a typical HR dataset, there's an expectation that complex models simply require more data to prove their worth.
You'd be better off starting with an interpretable model and then demonstrating the added value of complex approaches.
Even before tackling the choice between statistical methods, it's important to select a prediction time horizon. Using a short time window (e.g., 3 months) means less time for managers to act, but the data for predicting outcomes within this time window is usually more accurate. A longer time window (e.g., 12 months) allows managers more time to act, but there's a chance that key changes impacting an employee's decision to leave within that timeframe haven't occurred yet.
The longer the time window, the greater the decrease in prediction accuracy, similar to the way weather forecasts become less accurate the further into the future they aim to predict. Choose a time horizon that reflects how long your interventions take to roll out (e.g., a promotion cycle, an internal move).
Research into employee turnover has existed for a long time, and it's shown that an employee's intention to leave is a predictor of actual turnover, although not a perfect one. Employees who claim to leave sometimes stick around and people often leave without ever stating their intentions. Employee attrition models can incorporate employees' employment histories and context (surveys don't provide this) to find other useful patterns.
Of course, even these models won't be able to incorporate a phone call an employee received from a recruiter last week.
If you're a global enterprise with lots of employees and comparable roles, you may be able to harvest enough instances of voluntary attrition to test these claims. You may even have a people analytics team that could help you recompute predictions and risk scores after significant organizational changes like compensation adjustments or reorganizations.
Another advantage of creating an employee attrition model is that it gives your organization a bit more control. You pick the question, you collect data, and you set the threshold at which you identify someone as being at risk of turnover. In this controlled scenario you can assess whether a pattern exists among your workforce rather than assuming a global trend will apply.
On the other hand, even if an attrition model predicts that employees at a given tenure or job level will leave, it may not offer managers guidance on how to respond to this information.
It's also important to consider the base rate of voluntary turnover in your population. If voluntary turnover is low, most of your flagged at-risk population won't actually quit, and managers will notice this within their teams. This means that the key statistic is how many people actually quit from the at-risk population identified by the model? - and not some accuracy statistic like AUC.
Finally, you want to gauge model calibration i.e., whether employees predicted to have a 30% risk of turnover actually experience a 30% risk of turnover.
What does it take to develop and maintain an effective attrition prediction model?
First, developing an effective attrition prediction model may not be your first priority.
At first, your priority may be determining whether you can link together, or clean up, enough of your records to generate meaningful data and insights. Do all your systems speak to one another? Do you know when an employee received a promotion, or just when that promotion was logged?
Do you know when employees left off work, or just when they were taken off the system? Are voluntary exits consistently recorded, or do mutual agreement separations inconsistently get logged depending on which HRBP processed them?
Any of these data issues can affect the quality of your model. Consider data leakage, a common pitfall. If your model uses data that's only captured after an employee gives their notice (e.g. steps taken to offboard an employee that happened before their official termination date), then the model's effectiveness during testing will be falsely high, and its effectiveness in production will be low.
Similarly, if your team randomly splits the data into training and test sets, you may not get an accurate sense of the model's effectiveness. If your training data and test data both contain employees from the same reorganization or compensation cycle, the model will get a flattering test. It's better to train your model on data from earlier years and test it on data from a later year, similar to how forecasters run hindcasts.
This way, if your model's effectiveness drops when tested on a more recent year, you can appreciate its fragility before it's relied upon by managers.
Over the course of developing your attrition prediction model, you'll need various people on your team - from someone who understands the integration and validation of your HRIS data, to someone who has the technical know-how to develop the model, to someone with HR expertise who can challenge assumptions. These people may not be the same person. You'll also need to identify an owner for the prediction model once it goes live, because the people who built it will move on to other projects.
If you're operating within a small team, there are special challenges you may face. One business unit may only have a limited number of voluntary separations per year, making it impossible to generate a robust prediction model for that business unit. You may need to pool different business units together to generate a large enough sample, but this risks creating an overly generalized model that's more reflective of the attributes of the largest business unit and less concerned with the uniqueness of other business units.
Business composition changes over time as well. The introduction of a new manager, new pay structures, or new remote working policies may change which historic patterns are applicable to employee attrition.
There's another subtle challenge as well. If you flag employees at risk of attrition, and your managers respond to these flags successfully by retaining people, this will reduce the measured accuracy of your prediction model, making it seem like a failure unless every intervention is manually logged. Similarly, if your model becomes less effective over time, it'll need to be re-evaluated on a scheduled basis and potentially retired if it no longer provides value.
In other words, developing an attrition prediction model isn't something to do on the side. That doesn't mean you can't build one, but it does mean that you need to account for it - by giving it an owner and an upkeep budget - before asking it to start generating predictions.
You also need to consider whether your organization will trust the model.
Where surveys fall short
While employee surveys are helpful, they do have drawbacks.
First, surveys can be hampered by low response rates. Low response rates can signify that employees feel too busy to complete the survey, don't think anything will change, or are worried about being identified. It can also mean employees missed the survey entirely.
Unless you take a close look at response rates by team or tenure, you may not notice that your "steady" team results are only based on responses from the most satisfied half of your team.
Secondly, some employees may decide to leave before their survey responses change, while others may continue to provide polite responses while they interview elsewhere.
At the University of Washington, Thomas Lee and Terence Mitchell developed an unfolding model of turnover that explains the different paths employees can take to exit an organization. Some of these paths start with what they call a single "shock" such as not receiving a promotion, a partner moving to a new city, or an unsolicited job offer. Some of these employees may quickly decide to leave without going through a gradual period of dissatisfaction - making it harder for surveys to pick up on this.
One way organizations can plan for these sudden exits is by keeping an eye out for these shocks. For instance, which employees were just passed over in a round of promotions? Have any employees just lost a manager who acted as a champion for them?
These are opportunities to conduct a stay conversation regardless of survey results.
Finally, it's worth considering the limits of survey anonymity. Employees often feel more comfortable speaking freely when they believe an anonymous survey will remain anonymous.
For instance, if people use filter questions to select themselves out of a specific group that then falls below the threshold, that information could be used to identify them. Similarly, subtracting reports that overlap can identify individual respondents. Even something as simple as sharing a unique verbatim comment from a small team can reveal the identity of the individual who shared it.
As Amy C. Edmondson explains in her book, The Fearless Organization, people are constantly weighing the personal risk of speaking up against the benefit they will receive. One visible breach of confidence can change the way an entire team weighs the risks of speaking up for years to come.
Sure, there's a place for annual surveys. But if a manager only sees a concern once a year, then waits another year to check in with that employee about it, it'll feel like a tick-box exercise.
This isn't something that can be remedied by simply putting more pulses in place. You need to line up your survey cadence with your action cadence.
How do the two approaches compare?
Let's be honest: Neither is a perfect solution.
Which approach is better for you depends on what data you do have, and what you expect managers to do with the result.
| Question | If you want to use engagement data | If you want to build an in-house model |
|---|---|---|
| How much work is required upfront to get results? | Not much, if you already have employee engagement surveys. You need comparable items across cycles to analyze. | Quite a lot. You need to clean your data, enlist specialists to support you, and ensure your data is valid. |
| What level of maintenance is required? | You need to make sure your response quality is good for various segments of the population, and take action and close the loop with employees. | You need to continue feeding accurate data into the model, monitor for data drift, keep a log of any interventions, and monitor the model's fairness. |
| How quickly can we start using this? | You can start using this within a few weeks of having survey results and a way to access those results. | This will likely take months, due to the time commitment required to get the data in good shape. |
| What exactly are we predicting? | You know which groups report certain conditions (items) known to increase the likelihood of turnover based on your survey results. | You can predict, based on data you have, which records (employees) have patterns similar to previous employee patterns. |
| How accurate are these predictions? | This is not for individual-level predictions. You can test whether trends within teams lead to higher rates of team-level exits. | You can test accuracy by comparing future exits, but the low base rate of exits can lead to a high number of false positives. |
| What is the likelihood managers will trust this? | It's easier for managers to trust discussions about team-level trends and specific items. | This depends on how interpretable the model is, i.e. can managers understand why someone was flagged and what to do? |
| What level of scale can this prediction be applied to? | You can apply this across a large number of teams, though you'll omit the smallest teams due to minimum survey response requirements. | You'll need a sufficient number of clean, comparable exit records for each population you want to apply the model to. |
Be wary if someone tells you they can compare the "accuracy" of these options in one big number.
Identifying the accuracy of a survey approach that looks for employees reporting decreased confidence in their leaders and an in-house model that predicts an exit within 6 months are two very different tasks.
You can also conduct a "validity check" for the survey approach. Using item trend data at the team level from the previous year, analyze whether teams that experience a steep decline in certain items subsequently have higher rates of voluntary exits in the following two quarters. If there's a correlation, great.
You have local evidence to invest in actioning these items. If not, you may want to conduct analyses to see which items can lead to a higher rate of (voluntary) turnovers within your organization before investing in something new.
You can also conduct a "validity check" for the churn prediction model. Before you start, define what you want to predict (e.g., voluntary turnover? Regrettable turnover?) and define how far in the future you want to make this prediction. You can then compare the prediction power of your model against a simple baseline - for example, a prediction based on tenure and time since last promotion.
Ensure your predictive model is used for good
Ensure an employee doesn't lose an opportunity because a predictive model deemed them likely to quit. This is a common self-fulfilling prophecy type of issue where employees flagged as at risk of quitting are not given stretch opportunities "because they're going to quit anyway".
Keep in mind that flagging someone as at risk of turnover may also be reflective of historical biases in promotions or pay that have nothing to do with the employee's choices.
Before you allow employees to be evaluated based on their risk scores, evaluate the results across different groups.
Simply removing a protected characteristic from an algorithm doesn't eliminate the impact of that characteristic. For example, part-time status, leave of absence history, and tenure can reintroduce gender, caregiving, and age information.
Evaluate the rate of false flags within different groups. If one group is flagged at a much higher rate, but their turnover rate doesn't match the increase in false flags, their risk scores are doing them harm, even if the model overall boasts a high accuracy rate.
Evaluate your privacy obligations before joining employee records or changing the way you use employee survey answers. In the EU and UK, calculating individual risk scores will typically require a data protection impact assessment. In many countries, works councils have co-determination rights with respect to tools that monitor employees.
Engage with them before introducing a pilot, not after. Ensure employees understand what you're collecting, why you're collecting it, and who will see the results. Limit access to the results to the appropriate roles within your organization.
Above all, avoid turning an anonymous survey into a tracking tool for identifying individuals.
If your team wants to use identifiable employee feedback for retention purposes, collect it through a separate process with a clear purpose (e.g., stay interviews).
How Sparkbay can help you identify retention risks in your team's feedback
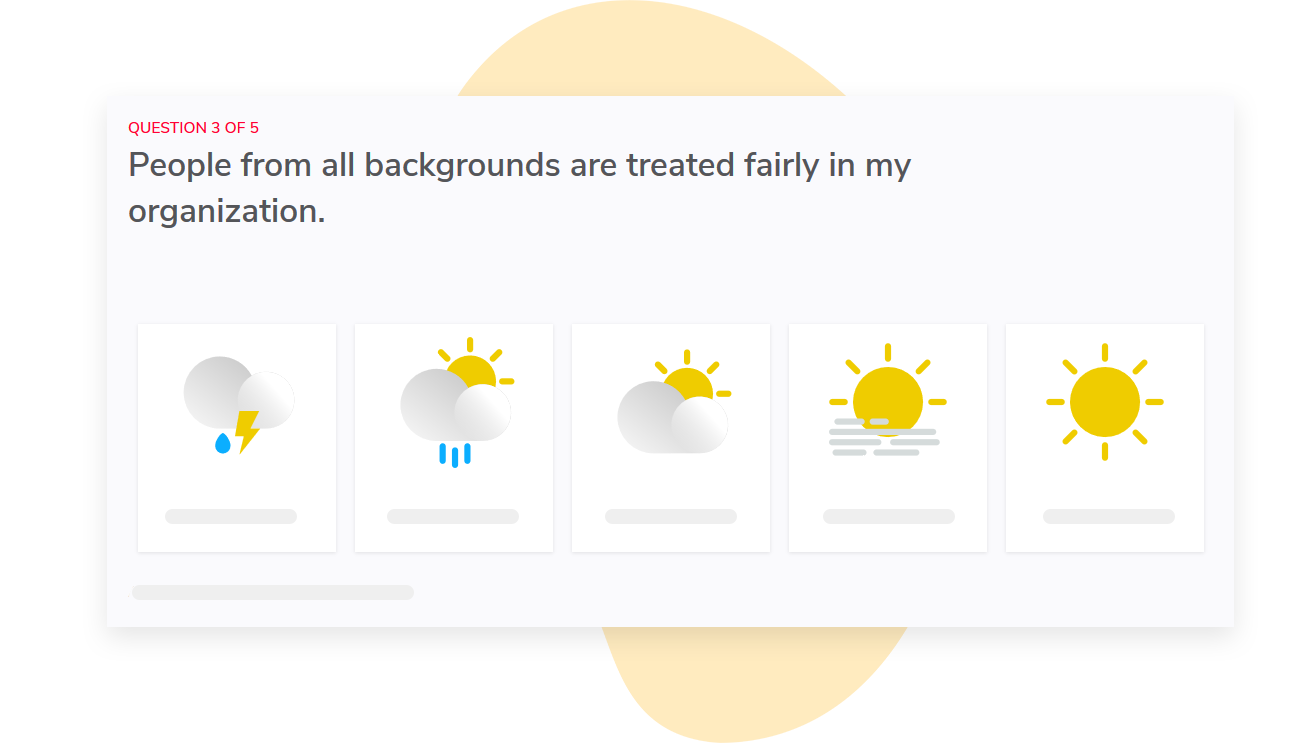
With Sparkbay, we can help you identify changes before the next annual survey. Many teams opt for a monthly pulse. This allows a manager to see if concerns about growth or workload keep coming up instead of assuming that one difficult week is the whole story.
You can customize the wording in our surveys and dashboards to include the growth question phrased in a way that makes sense for your organization and track that question alongside the engagement score out of 10.
Our reporting features let you compare results across different groups and over time. HR teams can use this feature to determine whether a drop in scores is limited to one team or impacting an entire department before starting a conversation with managers to understand the issue.
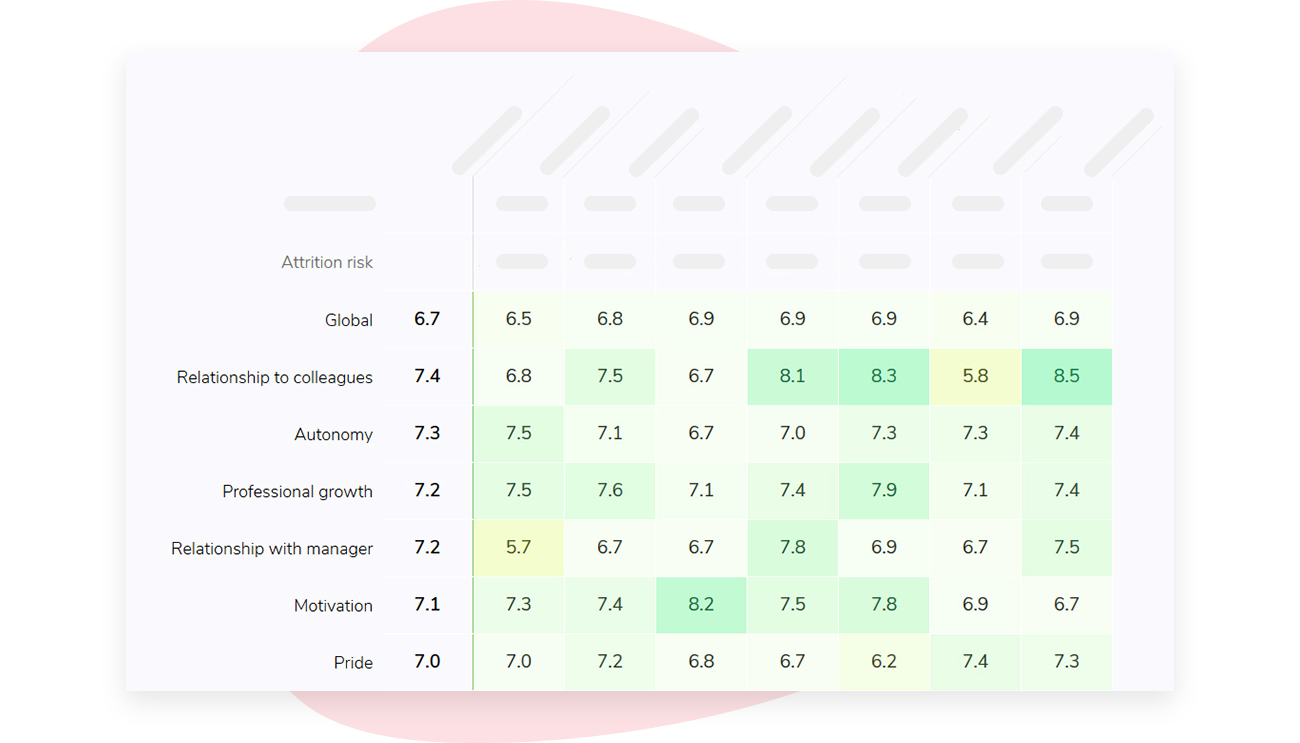
We automatically hide your results if your group doesn't meet the minimum number of responses (5 by default, but this can be changed). We also respect your org hierarchy when giving you access to reports, so managers only see results for their teams and not others.
This gives you privacy and security while empowering you to take action. Of course, there's still a human element needed to ask employees what they would like to see to make their work better and to follow up on those responses.
If you're interested in learning how Sparkbay can help you build a more engaged workforce, you can click here for a demo.
Choose a starting point you can support
So what's the "right" place to begin?
If your company has a few hundred staff and little help with analytics, you probably don't have the volume of exit data needed to build a model.
The safest bet is to start with the engagement data you already have and believe in.
Look at how individual items shift across teams, break response rates down by group, and let managers talk through the results.
If you're a medium-sized organization, you might do structured stay interviews when you expect possible shocks (e.g., a promotion cycle that went badly or a change of manager).
You might also look at broader trends, such as how often people leave depending on time since their last promotion or the number of months since their manager changed. These are all helpful activities even if you never build a risk score.
If you're a global company with tidy records and a people analytics team, you might want to experiment with a custom risk model using your own data. You can also gather input through surveys.
You might want to trial these models in "shadow mode" (where scores are produced for people, but not shown to anyone).
After some time, you can check the predictions against who actually left to make sure the model works as intended and isn't making errors at different rates for different groups of people. All of this needs to be done before a model is used to help make any decisions.
Above all, don't let the size of your employee base be the only thing that determines this. You need to check whether you truly have enough exit data that can be compared.
You also need to know whether someone is available to keep the model updated and maintained. And will there be an obvious step for managers to take once they receive an alert that an employee is at risk?
If there's no obvious step for a manager to take, then your risk model is not ready - no matter how accurate it is.
And if you need to respond to a retention problem now, don't wait. Go ahead and address it.
Turn the next steps into a conversation
A decreasing growth score may prompt managers to ask employees about their career plans. A pattern of employee turnover after a manager change may prompt HR to investigate onboarding processes for new managers or check in processes for new teams within the first few months.
Of course, none of these insights justify a manager informing an employee that they're considered a flight risk.
Instead, before purchasing or creating a new flight risk prediction tool, take a hard look at what happened during your last 3 survey cycles. What concerns did managers hear? What steps did managers take?
What questions do employees still have?
If you're interested in learning how Sparkbay can help you build a more engaged workforce, you can click here for a demo.