Your people analytics lead comes back to you with the latest survey results. The customer support team scored an 8.1 out of 10 on employee engagement, up from 7.6 the previous year.
Great news!
But then your HR business partner points out the difference in the survey questions. Last year’s survey asked support team members whether they felt motivated at work, while this year’s survey asked them whether they felt proud to work here.
Obviously, these aren’t the same questions, but now you’ve got an issue. Because how do you explain this difference to the VP who already has the 8.1 plugged into their leadership update?
The truth is that you don’t know whether your team’s data just went up because of the change in survey questions or if the increase is genuinely real or if it’s a combination of both.
In this guide, we’re going to walk you through what you need to know to make your employee survey results comparable. We’re going to skip the basics about setting goals, question types, and launch emails.
We’re going to focus on areas where comparability can be an issue in large organizations.
We’ll discuss how to handle situations where you have validated survey items that you may want to "lightly edit".
We’ll also discuss how changing or focusing a scale can impact the comparability of your results. Your survey items may also need to be translated to different languages for different markets. And we’ll discuss how changes in translation can impact comparability.
We’ll also discuss the impact of changing governance on your ability to make your survey results comparable.
Let’s get started.
Choosing survey items and a rating scale that produce trustworthy engagement data
- In this guide
- Your survey is a measuring instrument
- Why does a change in wording make the results different?
- Start with the decision
- When can I borrow a question and when do I need to write my own?
- Will this small rewrite create a quiet break in the data?
- Should you use 5, 7 or 0-10?
- Avoid double-barrelled and leading questions
- Why people keep agreeing
- Maintain trend data integrity while giving leaders flexibility
- Use engagement as the anchor and eNPS as a second view
- How Sparkbay can help you keep survey results comparable
- Launch the survey, listen to your employees, and follow through
In this guide
- Think of your survey as a measuring instrument
- Changing the wording of questions changes the results
- Start with the decision you want to make
- When can you borrow a question? When should you write one?
- Why small rewrites can cause big changes
- Should you use 5, 7 or 0 - 10 scale questions?
- Avoid double-barreled questions
- Why people tend to agree with questions
- How to give your leaders flexibility while maintaining trend data
- How to use an engagement question as your anchor question and use eNPS on the side
- How to launch your survey, listen to your employees, and follow through
- How to choose the right questions for your survey
Your survey is a measuring instrument
Most comparability failures aren’t design mistakes at launch. They come from drift.
A leader softens an item in year two, a translation vendor "improves" a label, or a reorg changes which employees count as one team. Each change is defensible on its own. Together they quietly end your time series.
A trend holds up only if four things stay fixed: the item, the scale, the definition of the population and the timing window. If any one of them changes, you’re comparing two instruments.
The population piece gets missed most often. If support absorbed a newly acquired team this year, an 8.1 against a 7.6 compares different people as well as different questions.
Store each respondent’s org unit as it stood on the survey date, not as it stands when someone runs the report. Otherwise last year’s scores get silently re-cut into this year’s structure, and the history changes every time the org chart does.
Timing belongs on the same list. A survey run the week after bonus letters and one run in the middle of a peak season are not measuring the same moment, even with identical items.
A practical test for every proposed change: sort it into one of three buckets.
- Cosmetic changes, such as a dashboard label or a colour, leave the trend intact.
- Corrections, such as fixing a typo that didn’t alter meaning, leave the trend intact if you log them.
- Measurement changes, meaning anything that touches wording, scale, labels, position, translation or population, start a new series. No exceptions for changes that "feel small".
Why does a change in wording make the results different?
As Norman Bradburn, Seymour Sudman and Brian Wansink write in their book, Asking Questions, the way a question is worded, the order of the questions, and even the options available for responses can all impact how survey respondents answer.
Suppose you’re interested in asking employees if they have the resources they need to do their jobs. If you ask a question using the word "resources" and then change it to "tools", the employees may only think about software when considering their response.
In this case, they may not consider other issues like staffing levels or time pressures, which are often more relevant when it comes to teams like support or operations.
Although the revised question may read better, it now measures a more limited set of data. If your score improves, you won’t know if it’s because resourcing actually improved or because the question failed to pick up on the real issue.
The response options in a survey question can also impact the survey results. For instance, consider the choice between "Neither agree nor disagree" and "Unsure".
If your survey platform gives an "Unsure" response the same weight as a midway, neutral response rather than treating it as a missing value, your scores will be compromised since non-responses are being averaged into your score. Make sure you check how each null response option is coded before making comparisons.
What about the order of questions? Can that change the meaning of survey results? Yes, in fact, it can.
If your survey asks an overall satisfaction question, right after asking specific questions about workload or pay, employees may answer the overall satisfaction question by considering their responses to the previous questions.
This means that even if your overall satisfaction item stays exactly the same, it won’t be the same once it’s moved from, let’s say, position 3 on the survey to position 15 on the survey since employees will view it in a different context.
Split-ballot experiments in survey methodology - where different versions of a survey question are given to random halves of a sample - have demonstrated that there can be significant effects based on survey question wording or answer options. These effects can be as impactful as year-over-year differences that business leaders respond to.
Start with the decision
What will someone do differently based on the answer to this question?
Do you want to track engagement across business units?
Or understand why a specific process is giving new hires difficulty?
These are two very different jobs.
The former requires a short, stable list of items fixed in position and timing.
The latter requires questions that you’re prepared to remove once the issue is resolved.
Mixing these two purposes leads to challenges like survey length.
Each stakeholder wants to add their question, lengthening the survey and compromising the quality of responses to questions that appear later as people start satisficing (selecting the same column, skimming the question, or only answering options that are acceptable).
Plus, if new questions push your core questions further down the form, their scores may change despite no change to the question wording.
When your survey team receives a proposed question, have them identify who will use the results of the question and what decision they will make.
If no one can identify the decision maker or the decision that the question will impact, the team can hold off on adding that question this cycle.
This rule also helps your team navigate conversations with senior leaders who want to add "just one more question".
Team members can politely ask, "Who will act on this information and what decision will they make?" rather than getting sucked into a compromise about survey length.
You can also apply this decision rule to questions that your team may already have in the survey.
If it turns out that all plausible responses to this question lead to the same action, then the question is superfluous.
When can I borrow a question and when do I need to write my own?
When we say that a survey item is "validated", we may be referring to different levels of validation.
Some survey items may be validated through cognitive testing, factor analysis, test-retest validation, validation to ensure an item functions the same way across different demographic groups or languages, and so on. Other items may be considered "validated" because they are generally sensible and reasonable.
If a vendor or consultant tells you that a survey item is validated, ask them to provide details on what exactly they validated, with which populations, and in which languages. If the item has only been validated in English, then the validation process does not apply to your French, German, or Japanese workforce, for example.
Even if an item has been strongly validated, it may not work well in your context. However, strong validation means that there is evidence to support this survey item, and that there isn’t evidence to support a question your team composed last Tuesday.
Survey items that have been tested are best used when you’re asking leaders to monitor specific measures over time (e.g. engagement, inclusion) or when you plan to compare your data to an external benchmark.
External benchmarks usually have strict requirements about survey wording, response options, and scoring methods. If you want to compare your data to a percent-favourable benchmark, you can’t compare that to your mean score.
You should also pay attention to the population used to create the benchmark. If the benchmark was created using data from technology companies with mainly office-based employees, it may not be very informative for a manufacturing or retail workforce.
There are also times when you’ll need to write a custom survey question. This will happen when you want to ask employees about an organizationally-specific subject. For example, you may want to know if employees know how to access the new internal guidelines for handling customer complaints.
A general resource-related survey item won’t help you answer this question and it wasn’t designed to do so.
Keep this in mind when you’re incorporating company-specific questions into your survey. You want to keep a survey core stable so you can retire a question about a rolled out feature while still maintaining your survey history.
You also want to maintain the integrity of your engagement survey, since there is strong evidence outside of your survey that supports the importance of engagement. Large-scale analyses by Gallup have shown that engagement is linked to better retention and customer outcomes across a large number of workplaces.
This is evidence that applies to survey items that were studied. Once you change these items, you can’t apply this evidence to your modified items.
Will this small rewrite create a quiet break in the data?
Leaders often ask to make validated survey items sound more like the company.
For instance, switching the word "organization" to "family" may seem like a minor change, but it’s a big deal for someone who likes their colleagues, but doesn’t view their workplace as a family. That employee now has a valid reason to disagree with this statement that has nothing to do with their engagement at work.
Another example is changing a statement from, "I intend to stay" to "I can see a future here." The latter is a softer statement that allows employees to respond with hope rather than concrete plans.
If your retention analysis relies on intent to stay as a leading indicator of attrition risk, then changing the wording of this survey item undermines the assumption you are relying on.
In addition, once you change an item, you no longer know if it performs the same way as the originally tested item. You also lose the ability to make clear comparisons between respondents who have the original item versus respondents who have the revised item.
Pay close attention to suggestions that change one of the following:
- The time frame: "in the last month" versus no time frame at all
- The subject: "my manager" versus "leadership"
- The strength of the claim: "My manager gives me feedback" versus "My manager gives me useful feedback."
- The perspective: switching from "I" to "we" which moves the statement from a personal judgement to a guess about the team’s experience
If the tested wording of a survey item truly does not fit your workforce, go ahead and change it. But recognize that you’re creating a new metric, and that a new trend line will need to be created.
Should you use 5, 7 or 0-10?
Despite what vendors may suggest there isn’t a rigorous research case for any particular length of scale.
What matters is that your scale is clearly labelled, appropriate to the question you’re asking, and consistent across survey cycles.
There’s some merit to using a 0 - 10 scale, since it makes it easy for you to report a single score out of 10. But if a large part of your workforce is frontline, you may wind up with longer scale buttons than you like on your mobile device.
If the 11 buttons wrap onto two lines, this may confuse people and lead to misinterpretation of the scale.
Here’s another myth you can dispel: Using a scale with more steps doesn’t automatically lead to richer data.
If your question is vague, more numbers simply lead to more granular noise.
If you want to be able to pick up small movements in your strong teams, and report a single anchor score, a 0 - 10 scale is fine.
If you’re asking a question about frequency or a more concrete behaviour, you’ll want to use a 5 point scale with full labels describing the frequency.
If you’re participating in an external benchmark exercise, you’ll need to use the scale specified.
Leave room at the top
Suppose most people on a strong team select the top option on a 5 point scale. How do you then differentiate between a team that feels good and a team that feels great?
What’s more, you may not be able to pick up when an excellent team starts slipping, because the first people who drop from "exceptional" to "good" have no space on the scale to reflect this change.
A 0 - 10 scale can give those employees more space, though you may still have a ceiling effect if almost everyone selects 10.
In the pilot survey, it’s worth looking at the distribution of responses within each group, not just the average. If there’s a high percentage of respondents at the top of the scale, you can recommend reporting the distribution of answers alongside the average to avoid misinterpreting an overall flat trend as stability.
Check what the labels mean in each language
Words like "somewhat" or "fairly" do not carry the same weight in all languages. Something that sounds natural in the English version of your survey might sound stronger or weaker when translated into Canadian French or European French.
Survey-method research has shown that people use the ends of rating scales differently depending on the country they’re in. This can be more than just a translation issue. It can be a response style issue.
While a numeric scale reduces the number of verbal labels you have to make consistent, it does not nullify these differences. This is one of the reasons why ranking countries against each other using raw scores can be problematic. Comparing each market to its own trend is more defensible.
How do cross-national survey programmes give themselves the best chance at generating comparable responses? By using a team translation approach rather than relying on a single translator. This process involves generating two independent translations, conducting a review to reconcile differences, naming an adjudicator to make decisions on translation choices, pre-testing translations with real respondents, and documenting translation decisions.
You don’t have to go through the whole academic process, but you should have more than one translator, have someone adjudicate disputes, and keep a record of translation choices.
It’s also important to piloting the wording of questions and endpoint labels with speakers of different languages in your various markets. Check what they view as the meaning of a midpoint on a scale.
You shouldn’t take a translated phrase to be fine for Québec and France just because it uses the same words.
When you’ve chosen a scale, use it
What if your analyst decides to convert 5-point scale results to 0 - 10 results using a simple formula?
While this is possible, it assumes that respondents use the end points and intervals on both scales in the same way. They don’t.
Moreover, this conversion cannot account for finer distinctions that employees never had the opportunity to make.
If you do see a need to convert a score on your chart, mark it clearly as an estimate and make a note that it is not a seamless extension of previous survey data.
If you decide to use a 5-point scale or a 0 - 10 scale for your employee survey questions, pilot it using your real survey questions.
Avoid double-barrelled and leading questions
As mentioned, you should already be screening survey questions for double-barrelled items. But it’s worth flagging again. The double-barrelled questions that slip through are often from a senior stakeholder or a "combined" question that was written to keep the survey short.
For example, consider the survey item: "My manager gives me clear goals and regular feedback". This is a double-barrelled question. If an employee feels like they have clear goals, but they don’t receive regular feedback, they won’t have an accurate answer for this question.
To fix this, you could split this question into two separate survey items: "How clear are your goals?" and "How often do you receive feedback that you find useful"? Your employee survey will have one more item, but the results will be more actionable for managers who will know which area to focus on.
Similarly, you want to avoid leading questions. A leading question assumes something about the respondent. For example, "How much do you value our new flexible work policy?" assumes the employee values the new policy.
A better question would be "How well does our flexible work policy meet your needs?" with an option for people to select if they haven’t used the flexible work policy yet. This answer option would be scored as a "missing answer" and your survey results would include how many people chose this answer.
If there’s a high percentage of people who choose this answer, you’ll know that the flexible work policy hasn’t reached the people yet. This is a meaningful finding.
Another useful tactic for avoiding double-barrelled or leading questions is to do a think-aloud pretest with your survey. Ask a few employees outside of your survey team to read each survey item aloud and say what they think the survey question is asking.
Keep in mind that survey responders go through distinct steps to answer a survey question, as explained by Roger Tourangeau, Lance Rips, and Kenneth Rasinski in their book The Psychology of Survey Response. They go through the steps of understanding the question, recalling relevant experiences, producing a judgement based on those experiences, and then mapping their judgement to the response options offered. A bad survey question might fail at any of these steps. Think-aloud activities help you identify where your bad survey questions fail.
You can structure your think-aloud questions based on these key steps. You can ask your participants whether they hear more than one question in the item, whether they understand what time period they should be thinking about, whether the question assumes that something is good, and whether a dissatisfied employee can accurately answer this question without disagreeing with the entire prompt.
Why people keep agreeing
Agree/disagree statements are convenient to write and reuse, but as a researcher, you should be aware of acquiescence bias. What is acquiescence bias?
Acquiescence bias is the tendency for respondents to answer positively to questions, especially when a survey includes a long list of positive statements, when employees feel uncertain about how their answers will be perceived, or more.
This can be problematic for surveys that want to compare the response of different groups. If one group experiences stronger acquiescence bias, they may appear more engaged in agree/disagree items when, in reality, their assumed engagement has little to do with their engagement level.
Research on survey response styles demonstrates that respondents have this tendency while answering both paper and online questionnaires. While this acquiescence bias is not present for every item, it tends to push scores up - and reduce score gaps - when looking at a whole block of positively worded statements.
So how do you avoid acquiescence bias? When appropriate, ask respondents to provide a direct rating. For instance, instead of asking employees to agree with a statement like, "My goals are clear." You can ask, "How clear are your goals?" and provide a response scale from "Not at all clear" to "Extremely clear".
This task is different for the employee than simply agreeing with a statement.
Keep in mind that changing the wording of survey questions you’ve taken from a validated survey is not recommended. See section 5 for more details. You should only incorporate questions that ask for direct ratings when writing your own custom survey questions.
Another recommendation from survey research is the use of reverse-worded items. Some experts disagree on reverse-worded items. On the one hand, they allow analysts to identify individuals who simply agree with everything.
On the other hand, these negatives can confuse respondents, particularly when translating them, and items that are statistically clustered together tend to do so because of their wording rather than because of what they’re supposed to measure.
Use reverse-worded items sparingly and avoid using double negatives.
Maintain trend data integrity while giving leaders flexibility
Local leaders may want to customize their engagement questions to reflect the style or activities of their local work. However, it’s important that your data analysts are able to treat all instances of that engagement question the same.
This means that each core survey item should have a permanent item ID, and that question wording, response scale, approved translations, and question position are all fixed.
Once you’ve decided on the core item wording, position it in the survey before the local leader’s customizable questions. This prevents a leader’s custom questions from impacting how employees respond to the core items.
When changes are made to core survey items, create new versions of the question. Maintaining a record of different versions of questions is helpful for showing what employees saw in different languages at what time, and who approved changes and why.
For example, if you want to change the label for a survey question in your dashboard for clarity purposes, but you don’t want to change the actual survey question, you can do so while keeping the same item ID. This is a cosmetic change discussed in section 1, and a change that will satisfy most stakeholder requests.
Identify an owner for the core survey question block. Otherwise, different people may approve different change requests leading to trend data problems.
If you want to replace a core survey item with a different one, conduct a parallel run for one survey cycle.
If your sample size is large enough, you can distribute the old survey item to a random half of the respondents and the new survey item to the other half, rather than distributing both items to all respondents. This prevents bias in survey responses that could arise if a single respondent saw both items and tried to make their responses consistent.
Ensure each half of the split sample - random half receiving item A, random half receiving item B - has enough respondents to support analysis at the level you want to analyze your data. For example, if you want to conduct analysis at the business unit level, a split sample that provides data for the whole company would only allow you to analyze the overall difference between groups, not differences at the business unit level.
While a parallel run may not demonstrate equivalency of the survey items, it allows you to see whether there’s an obvious break due to the survey change, and it allows you to create a documented bridge between the two survey item series.
Keep all approved translations in a controlled library. Otherwise, regional teams or translation vendors may make local changes that result in two regions using different versions of what headquarters thought was a single survey question.
Use engagement as the anchor and eNPS as a second view
If you use an engagement question with a consistent 0-10 scoring system, you can give leaders one number to focus on and easily understand within each cycle.
Plus, by presenting the distribution of scores as well as the average score, you can help leaders understand the nuances of the data. For instance, a team that’s mostly scoring 2’s and 10’s may have the same average score as a team where most people answer with a 6. These teams require very different conversations.
eNPS is helpful, but it’s a different exercise. It groups responses to a recommendation question into promoters, passives and detractors, and then subtracts one percentage from the other.
While this makes it easy to discuss eNPS changes, it also ignores the nuances within each group. It treats a 9 and a 10 the same, for instance, and a 0 the same as a 6.
In addition, because the calculation is based on percentages, it can rapidly change if there are small shifts in a small group. For instance, if you have ten people in your group, one person moving from the passive category to the detractor category changes eNPS by ten points, despite no other change in responses.
So avoid viewing eNPS changes as a validation of engagement changes. A recommendation question will capture other factors not captured by your engagement items, such as how someone views the job market or the employer brand.
How Sparkbay can help you keep survey results comparable
Since the main measure we focus on is an engagement score out of 10, teams can easily follow a consistent number from one survey to the next. eNPS is also available as a secondary view if teams want.
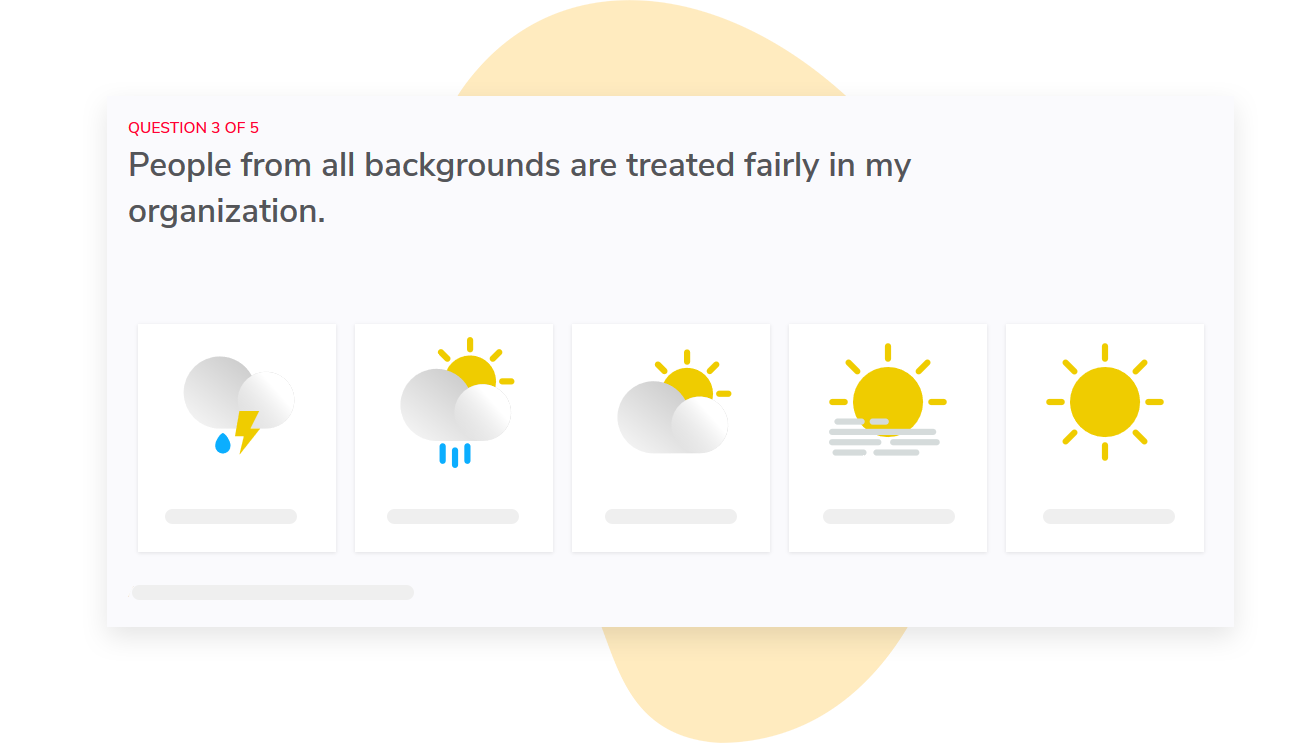
Sparkbay allows administrators to configure the wording of their surveys, dashboards, and what appears on the dashboards.
This allows teams to include specific questions while keeping the survey results comparable over time.
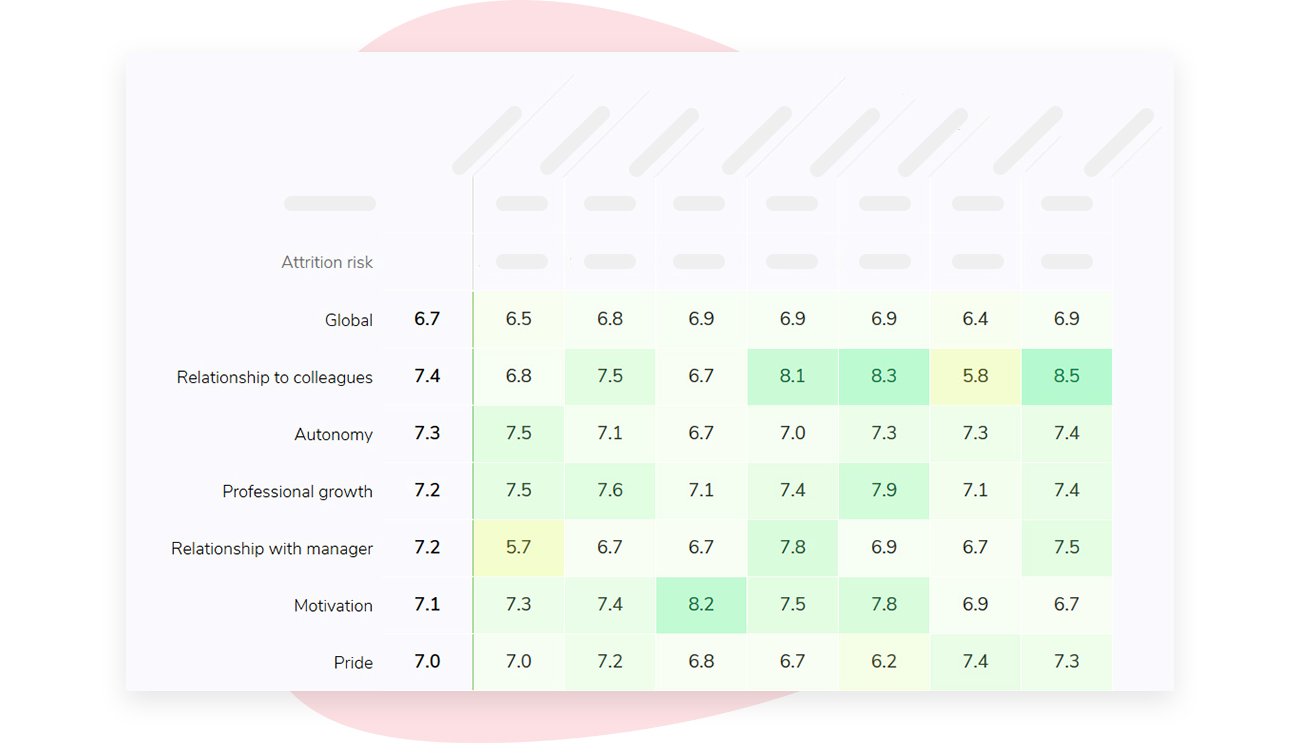
If you want to know where in your company a change happened, our reports let you compare results across different groups such as departments and managers.
We automatically map report access to your org hierarchy, so managers only see information related to their own teams.
To protect employee anonymity, we hide results from any group that doesn’t have a minimum number of responses. You can change this setting, but it’s 5 by default.
While we make it easy for you to compare results, it’s also important to create sound survey questions.
If you’re interested in learning how Sparkbay can help you build a more engaged workforce, you can click here for a demo.
Launch the survey, listen to your employees, and follow through
When you launch your survey, remind employees why you’re asking these questions, who will see the results, and what the minimum group size is for reporting results.
This is also the time to clarify whether your survey is anonymous or confidential. Employees often confuse these terms and treat them as the same promise. Make it clear whether you are collecting responses anonymously (not linked to their identity at all) or confidentially (linked to their identity but kept safe).
If you have a manager information session, you can also give them a one-liner answer to the expected questions they’ll get from employees, such as, "Can someone see my answers?"
Once your survey is done, you’ll want to keep the above considerations in mind when reviewing survey results.
For instance, if your survey question wording changed or a translated item changed, you’ll want to keep this in mind when interpreting the results.
Likewise, if the response rate for a particular team is significantly different, or the composition of respondents is different, this could impact survey results.
For example, if all of a team’s most disengaged employees left before the survey period, or stopped responding to surveys, this could artificially increase a team’s overall score.
You’ll want to compare the composition of survey respondents based on tenure and role to the previous survey cycle before making a judgment on survey results.
Even small teams dynamics can impact survey results - if two people out of a team of 12 change their answer, this can impact the average score quite significantly.
For smaller teams, consider survey results that show change over two survey cycles, or that show similar changes across multiple teams, before interpreting as change.
In short, use the information above to vet survey results before sharing with leaders that a particular team improved or declined.
It’s also important to share with employees what you did with their survey results.
Survey results that lead to no action make it harder for employees to trust future surveys - especially those people you really want to hear from.
When sharing survey results, it’s okay if you don’t promise to fix everything. Instead, you can share which issues you’ll be working on, who the owner is, and when people can expect to hear back.
Match the question to the survey
When writing questions for an engagement survey, you can use a core set of questions that have been tested and use the same 0 - 10 scale questions.
Similarly, if you’re distributing a short, pulse survey with certain items you want to track over time, make sure you include that item in the same position in the survey each time. Changing the wording every month defeats the purpose of these check-ins.
Onboarding surveys should be sent out at a consistent time interval and contain consistent wording. Instead of distributing an onboarding survey on a specific date, send it out after a specific tenure.
This way, you’ll be able to easily compare responses. A time 0 response is not easily comparable to a response 90 days from now.
Exit surveys are generally more effective when they have direct, specific questions. Since people want to protect their references, they will likely sugarcoat their responses to questions they have to agree with. A direct question like, "How often did you discuss your workload?" will get a more honest response than, "I felt like my workload was manageable".
When developing inclusion and wellbeing surveys, start with tested items. Once you’ve translated the questions, check to make sure the meaning of the question carried over to the translated version. Don’t just check to make sure the words were translated correctly.
And keep candidate surveys short and neutral.
Before distributing any of the above surveys, review the questions to ensure they support a decision. Double-check the core question wording, scale and question position. Ensure there are no leading questions or double-barrelled questions.
And finally, note any changes you make from the previous version in the right bucket (either cosmetic changes, correction or measurement changes).
If you’re interested in learning how Sparkbay can help you build a more engaged workforce, you can click here for a demo.