By now you know employee turnover is expensive. But why is it so hard to find an exact number?
Google “cost of employee turnover” and you wind up with a general number or statistic.
Replacing an entry-level employee costs 30% - 40% of their annual salary.
A mid-level employee 150% of their salary.
And a highly skilled employee up to 400% of their salary.
These general figures are helpful for making a point, and the point is that voluntary employee turnover is expensive. But it doesn’t help you make your organization care.
Why?
Well, it’s really easy to pull up a general stat, but once you walk into an upper management meeting, that number will come under scrutiny.
Where did it come from?
How did you find this number?
Is this number even relevant to our industry?
Is this based on our own historical data?
Before you know it, your entire presentation has been undermined.
Sure, everyone will agree that turnover sucks, but no one will agree on how to address it.
So what’s an HR leader to do?
You’re gonna have to get your hands a little dirty. We’re talking calculators, spreadsheets, and maybe a few data collection exercises with your team.
Sound frightening? Don’t worry. We’ve put together a handy employee turnover cost calculator.
Cost of turnover calculator
If you want to calculate cost of turnover yourself, here's step-by-step breakdown of what you need to do:
How you can retain employees using Sparkbay
Employee retention isn't something that you build and then stop working on.
You have to be in constant communication with your employees to make sure their expectations are met and they're currently happy at your organization.
This is especially true during times of change.
Here's how we can help you improve employee retention:
Our platform automatically surveys your employees at regular intervals (70% of our clients opt for monthly surveys).
Using this data, Sparkbay captures trends and alerts you in real-time when an employee segment shows an increased risk of turnover.
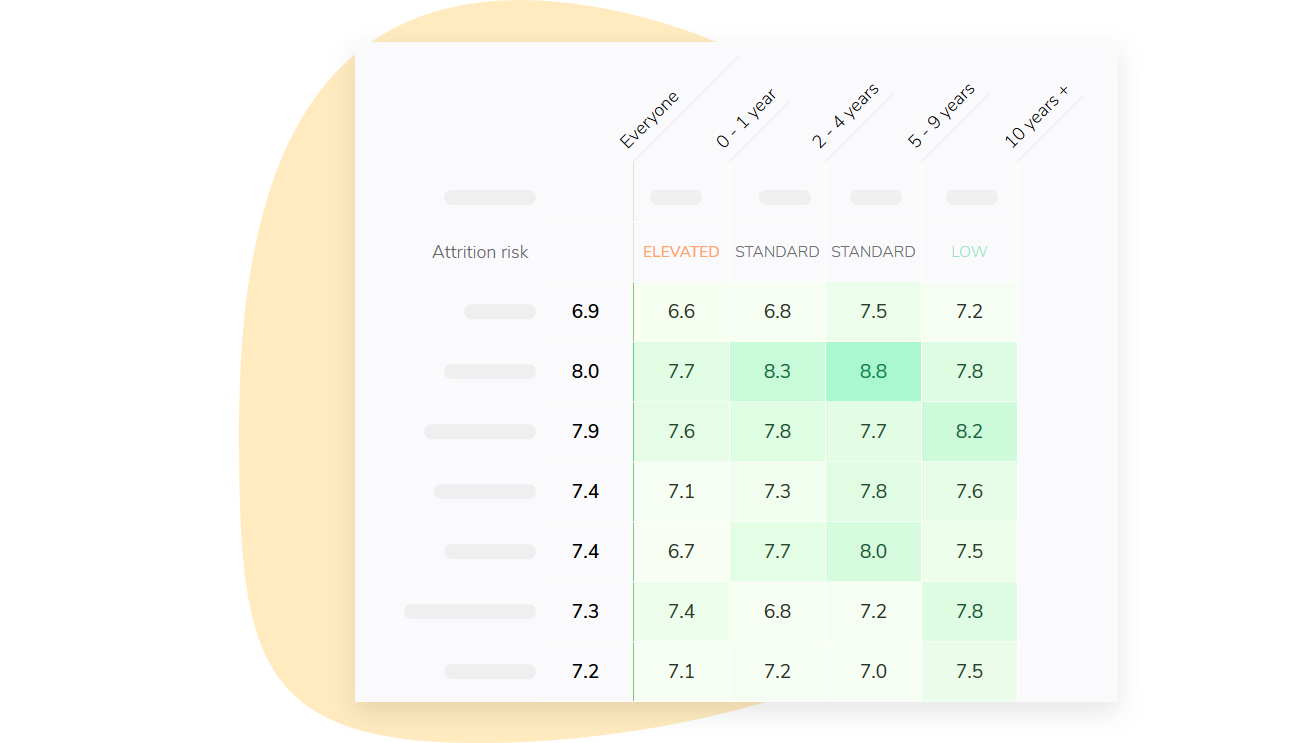
Sparkbay also uses data from recently departed employees to uncover the real causes behind turnover, empowering you to take early action and address the issues that matter before it’s too late.
We also created a library of easy-to-implement actions from the most successful organizations to help you and your team managers learn how to prevent turnover.
If you're interested in learning how Sparkbay can help you retain your talent, you can click here for a demo.
STEP 1 Make a list of all the processes associated with voluntary employee turnover
Think advertising and job boards are the only cost of turnover? Think again.
Voluntary employee turnover costs your business money even before an employee submits their letter of resignation.
How do you figure?
Well, disengagement is one of the top reasons employees quit, and this disengagement costs the global economy $7 trillion in lost productivity.
When an employee is unhappy, especially a good one, they’re unhappy for quite some time.
They discuss their dissatisfaction with trusted colleagues, volunteer for fewer projects, engage in presenteeism, and devote energy to looking for new opportunities.
And this is only one example.
So when you’re listing all of the processes associated with voluntary employee turnover, think beyond recruitment.
Here’s a pretty solid list to get you started.
- Cost of reduced productivity of an employee in the weeks leading up to their departure
- Cost of lost productivity in the time between the employee’s departure and the employee’s replacement
- Cost of reduced productivity of the employees/managers covering the departed employee’s work
- Cost of labor hours of the employees/managers who must be paid overtime rates to cover the departed employee’s work
- Cost of labor hours of the recruitment specialist/manager who is responsible for sourcing and screening candidates and scheduling interviews
- Cost of advertising for the open position
- Cost of jobs postings on job boards
- Cost of labor hours of secondary interviews with line managers and senior executives
- Cost to conduct background checks
- Cost to conduct credential verifications
- Cost of labor hours of training managers assigned to onboard the new employee
- Cost of reduced productivity in the first three months after a new employee’s start date
Some of these points may feel redundant, but it’s important to treat them as separate line items.
For example, you may wonder why you need to think about both:
Reduced productivity of the employees/managers covering the departed employee’s work
AND
Labor hours of the employees/managers who must be paid overtime rates to cover the departed employee’s work
Simple: You may have different types of workers on your payroll, so you should understand the cost breakdown for different scenarios. The more data, the better. And the more prepared you’ll be to address different situations.
You want your HR department to be a center of excellence when it comes to understanding your human capital.
Why not tackle your human capital management with the same precision your accounting department uses to track the company’s financial capital?
Here’s another thing you may be questioning. Why count costs like recruiting or training? Aren’t those activities we’ve specifically hired people to carry out?
Sure, but it’s now a question of whether you’re using those resources effectively.
Yes, a trainer’s job is to train employees. But if there’s a lot of voluntary turnover, they’ll be spending time training new people for the same role.
This is time they could have spent onboarding other employees or improving existing training processes.
And if there’s an outrageous amount of employee turnover, it may necessitate hiring a second or third trainer.
As an HR leader, you want to clearly identify how turnover drains valuable company resources in terms of both money and time.
STEP 2 Break down these costs into specific variables and gather your data
Okay, so you’ve got your list of potentially pricey turnover activities. How do you turn these points into solid figures?
First, you’ve got to break down what information you need.
Now, we know this is a tedious exercise, but believe us, it can save you a lot of time. If you carefully break down what you need, you can delegate the actual data collection to members of your team.
So invest a little time now to save a lot of time down the road. Don’t worry about the specific formulas or how these variables come together. We’ll tackle that in step 3.
Turnover Cost |
Required Data |
Comments |
|
Cost of reduced productivity of an employee in the weeks leading up to their departure |
Salary of the departing employee Average number of days between decision to leave and resignation letter submission |
In step 3, we’ve provided a formula that uses information on productivity levels gathered by Gallup. |
|
Cost of lost productivity in the time between the employee’s departure and the employee’s replacement |
Average output in dollars for employee in this function Average number of days position remains vacant |
Each role should have clear KPIs tied to a dollar figure (e.g., sales executive tied to revenue, customer representative linked to customer retention figures). This will help you understand productivity loss. |
|
Cost of reduced productivity of the employees/managers covering the departed employee’s work |
Hourly rate of compensating employees/managers Number of hours re-allocated to covering employee’s workload |
Our internal research shows that productivity reduces about 30% among employees covering departed workers. |
|
Cost of the employees/managers who must be paid overtime to cover the departed employee’s work |
Hourly overtime rate paid to other employees |
This is more applicable for employees working on hourly rates rather than a salaried situation. Of course, you do need to keep overtime hours in mind for your salaried employees as well. |
|
Labor hours of the recruitment specialist/manager responsible for sourcing and screening candidates |
Hourly rate of the specialist/manager Average number of hours spent on sourcing/screening scheduling |
Time spent replacing someone you could’ve retained is taken away from sourcing for other roles. |
|
Cost of jobs postings on job boards |
Job board costs |
|
|
Cost of advertising for the open position and referral bonus |
Cost of advertising the position and any employee referral bonus |
|
|
Cost of labor hours of secondary interviews with line managers and senior executives |
Hourly rate of Directors, VPs conducting secondary interviews Number of hours executive spend on secondary interviews |
This accomplishes two objectives. One, it gives you data on how well your company’s using its top people. Two, it makes the data relevant to a senior stakeholder’s day-to-day work. |
|
Cost to conduct background checks |
Vendor cost of conducting background checks |
|
|
Cost to conduct credential verifications |
Vendor cost of conducting domestic credential verifications Vendor cost of conducting international credential verifications |
|
|
Cost of labor hours of training managers assigned to onboard the new employee |
Hourly rate of training managers Average time spent on training by hiring managers |
Time spent replacing someone you could’ve retained is taken away from training for other roles. You may even have to hire an additional trainer! |
|
Reduced productivity of new hires |
Number of weeks it takes to get to full productivity Hourly rate of the new employee |
It can take up to two years for a new employee to be as productive as the departing employee. |
Challenges with Gathering Your Data
Even though you’ve got a hit list of data you need, it might be a bit challenging. Depending on your company, you could run into one of two obstacles:
- You don’t have enough historical data to come up with averages
- Choosing between company-wide figures versus department-specific figures leads to analysis paralysis
Challenge 1: You don’t have enough historical data to come up with averages
For much of your data, like time-to-hire, you’ll need averages based on historical data.
Now, if this isn’t in an easy-to-use format like a spreadsheet or your HRIS, you’ll have to get creative.
Best case scenario: The data exists, but it’s sitting in different documents like exit interviews or ad hoc reports.
In this case, you’ll need to invest some time into gathering this data into one spot.
Worst case scenario: This data hasn’t been captured at all.
In this case, you’ll need to ask your recruiters and managers to guess how many hours they spend on certain activities.
Just make sure you don’t rely on these guesses forever. Your employees should update these figures over time, and capture information they initially didn’t gather.
For instance, when you ask outgoing employees why they’re leaving their company, frame it as a learning opportunity.
Ask them why they’re leaving, when any dissatisfaction started, and when they started thinking about leaving.
Keep the chat non-confrontational and friendly so that you receive honest answers.
Challenge 2: Choosing between company-wide figures versus department-specific figures leads to analysis paralysis
You know what they say: Garbage in, garbage out.
Your insights are only as good as the data that informs them. So when you’re collecting it, commit to the process.
What do we mean by this?
Don’t settle for outdated, over-generalized figures.
For tangible figures, like wage hours, you should have a specific dollar figure rather than an average across the entire company. For time-to-hire, gather data on specific roles.
On the other hand, engagement levels can be company-wide. With time and proper tools, you can produce data on engagement levels across departments, but trying to do this from the start may be overwhelming.
If you’re questioning what data your peers will find valuable, ask!
Try to obtain buy-in from your CEO and CFO on what statistics they find meaningful, before moving forward on your data collection efforts.
The last thing you want is to complete an entire analytics project only to present the findings and have your findings dismissed because the stats are too general.
Sparkbay makes it easy to go to one spot and have a bird's eye view of what's happening. Each manager can pinpoint the goods and where to improve.
How NARS reduced turnover by 10% with Sparkbay
STEP 3 Plug your data into relevant formulas
Once you’ve got your data, it’s time to plug them into the right formulas.
A few of the costs we listed don’t have their own formulas. You can easily pull how much it costs to advertise a job or run a background check.
Finding other costs takes a little more work.
Calculating reduced productivity of an employee in the weeks leading up to their departure
Remember what we said earlier about disengagement. It often leads to an employee’s departure and it costs companies trillions of dollars in productivity.
This means that turnover starts costing you before an employee even leaves!
It’s time to find out just how much.
What |
How much |
Comment |
|
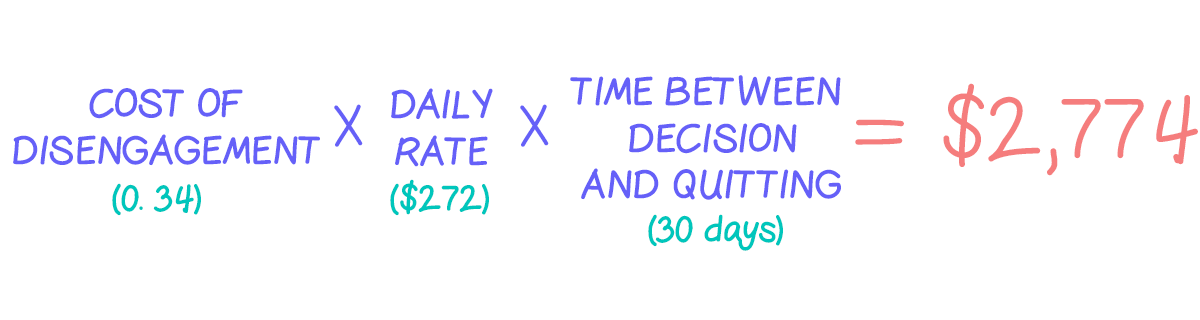
Cost of Disengagement |
34% |
Disengaged employees cost companies $3,400 for $10,000 of their salary. |
|
Employee daily rate |
$272 |
|
|
Duration of Time Between Deciding to Quit and Quitting |
30 business days |
Cost of disengaged employee before departure:
Calculating lost productivity in the time between the employee’s departure and the employee’s replacement
This is a pretty straightforward calculation, but it gets complicated depending on which employee you’re talking about.
Employees with KPIs Directly Attributed to Revenue
If you’re calculating the lost productivity of an employee with very clear KPIs like a salesperson or a business development associate, you’ve got the numbers you need.
For instance, if a junior sales associate or business development associate is supposed to generate $100,000 per year, you can do basic math to calculate the lost productivity.
What |
Value |
Comment |
|
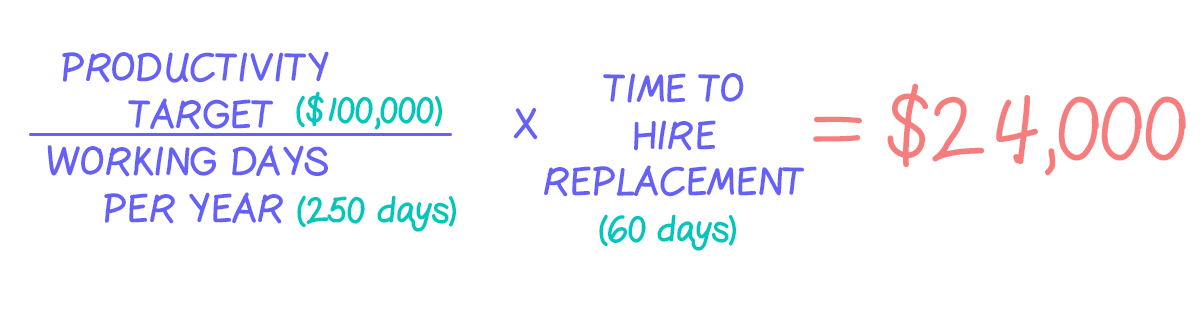
Employee productivity in terms of revenue KPI |
$100,000 per year |
If the employee is voluntarily leaving, they were probably meeting or exceeding their targets, so you can use expected revenue. |
|
Working days per year |
250 |
Assuming 2,000 hours/year and 8 hours/day. |
|
Time to hire replacement |
60 business days |
You could include weekends, since many salespeople work evenings and weekends in the name of earning a higher commission. |
Cost of interim productivity loss:
Employees with KPIs Indirectly Attributed to Revenue (Or Not At All)
Some employees may not have KPIs with obvious revenue attribution. With a little work, you can establish metrics for most roles by talking to department heads. Understand how employees are evaluated. Chances are there’s a dollar figure attached or there’s an opportunity for proper revenue attribution.
Job Function |
Performance Metric |
Financial Metric |
|
Sales |
Sales Quota |
Revenue generated from closed deals |
|
Marketing |
Lead generation |
Percentage of revenue generated through from marketing-qualified leads |
|
Customer Success |
Client Satisfactions Surveys/Levels |
Recurring revenue saved thanks to quality customer service |
|
Accounting & Finance |
Payment processing speed |
Cash flow percentage |
You can see where we’re going with this.
If you know that X leads generate X sales, you can figure out how many business opportunities you’re missing out on by leaving that Marketing Automation Specialist position vacant.
Let’s say customer service levels increase by X% for every 2 client success Managers.
And let’s suppose there’s a proven relationship between customer service levels and recurring revenue.
You can demonstrate how much money the company stands to lose with vacant positions on the customer service team.
And if you’ve got a fully-staffed financial operations team, you process payments better, ensuring your sales actually translate to a healthy cash flow.
Once you have these figures, you can apply them to the earlier formula.
Calculating the cost of reduced productivity of covering employees and managers
Even when an employee quits, the show must go on.
You may not be able to cover 100%, or 50%, or even 25% of the original employee's tasks.
But there are core functions like monitoring specific accounts or handling customer inquiries that have to be delegated to someone.
These lucky employees now have to manage someone else’s workload on top of their existing workload.
What’s more, they have to quickly get up to speed on what the other employee was doing.
As a result, their own productivity levels suffer. Sure they’re doing more, but they’re spread out much more thinly, limiting their effectiveness on individual tasks or products.
You can take two approaches to calculating this cost.
Option 1: Use the hours spent by your employees
- Calculate how many hours an employee spends on the departed employee’s tasks
- Multiply these hours by the employees hourly wage (their salary divided by 2,080, which is the number of hours in the average work year)
Option 2: Figure out the daily cost
Okay, so here’s the drawback with the first option.
You’re already asking employees to take on the work of someone who quit.
Now imagine asking them to track those hours and send them over to you.
It’s not a big ask, but they may see it as busy work when they’re already swamped.
You can use a general formula instead. Our research indicates that covering another employee costs about 30% of an employee’s daily rate. As an alternative, you can figure out your employee’s day rate and multiply it by 0.30 to find how much this is costing you.
This is especially important if someone with higher seniority (with presumably higher priority responsibilities and deliverables) is spending time on these tasks.
For Hourly Employees
For hourly employees, you can simply calculate the amount of overtime they receive to cover this work.
Calculating the Cost of Reduced Productivity of New Hires
New hires are excited and motivated. But all the enthusiasm in the world doesn’t eliminate the fact that it takes time to get them up to speed. And even once they’re done training, it takes time to get them to your previous employee’s level of productivity.
Admittedly, this is a tricky cost to measure. It can take up to two years to get your new employees in the groove.
The challenge is figuring out how long it takes to get employees up to speed.
Some companies consider a completed onboarding process the milestone. Others want to see an employee’s ability to complete specific tasks on their own.
You’ll need to chat with line managers and decide which metric to choose.
In the meantime, we suggest the formula below using the following variables.
What |
Value |
Comment |
|
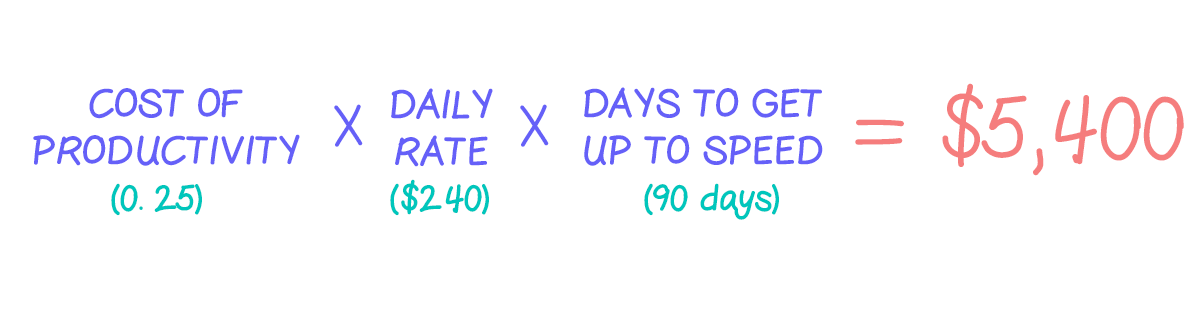
Cost of productivity |
25% |
|
|
Day rate of new employee |
$240 |
Assuming that target productivity is equals to salary. If you have productivity targets, you can use that instead. |
|
Number of days to get up to speed |
90 business days |
Cost of getting new employees up to speed:
Finding the Hourly Rates of Salaried Employees Takes Most of The Work
Once you’ve got the hourly or daily rates of your salaried employees, most of the work comes down to simple multiplication against time spent. This covers calculating costs like:
- Labor hours of the recruitment specialist/manager who is responsible for sourcing and screening candidates and scheduling interviews
- Labor hours of secondary interviews with line managers and senior executives
- Labor hours of training managers assigned to onboard the new employee
STEP 4 Add your data together to find the total cost of employee turnover
At this point, you should have all the data you need. We’re happy to say, it’s now as simple as adding everything together.
The total you get is your total cost of turnover for a particular role.
Now, this doesn’t have to be a tedious manual process. Sure, if you’re Excel savvy, you can develop sophisticated spreadsheets that allow you to plug and play with the data.
But that still takes time, presents version control issues, and is difficult to manage as your company scales.
That’s why we’re providing you with an easy to use cost of turnover calculator. Alternatively, you can download our Excel spreadsheet.
If you're interested in learning how Sparkbay can help you retain your talent, you can click here for a demo.