
Each time you shop around for an employee engagement platform, you're given an ROI calculator by each vendor.
Generally speaking, these look like this:
"Take a small percentage of your total payroll number, and voila! You've got your ROI."
But before you sign up, you need to ask yourself one important question: Will the benefits I've modeled actually show up as a reduced line item on someone's cost center budget?
So you've seen the demo. Your executive sponsor loves the heat map. And the calculator says you'll get back $3 for every $1 invested.
Sounds great. But what happens when it's time to renew your contract, and you can't separate the benefits of your employee engagement platform from a recent pay increase, a cooling labor market, or the departure of two divisional leaders?
But here's the thing: Employee engagement comes with a very real cost.
In fact, Gallup estimated that low employee engagement cost the global economy US$8.9 trillion in lost productivity in 2023 - about 9% of global GDP.
Despite that, it's still really hard to tell if your specific benefits tech will get you over your ROI/equity hurdle rate.
It's like deciding whether "software improves productivity" is a good enough reason to buy a specific ERP system.
As an HR leader, you need a sturdy, credible business case that can hold up to questions from Finance, and that doesn't rely on a vendor's best customer story.
Here's how you can create such a business case. You're going to need a spreadsheet, a little bit of data, and a clear understanding of the benefits an employee engagement platform can bring to your company.
You'll need to understand the full cost of the engagement platform. You'll also need to understand your current company's baseline (a date and a well-defined metric). And you'll need to break down the benefits you'll get based on whether you'll be generating direct cash, avoiding costs, or freeing up more capacity.
In the end, you probably won't get an exact number.
But you'll have a solid, well-defined ROI hypothesis for your company to test before you sign up.
Building a turnover-cost and engagement ROI model your CFO will sign off on
- Why a good intention won't survive the budget meeting
- Step 1: add up the real cost
- Step 2: freeze the baseline before you buy
- Step 3: put a price on each avoidable departure
- Step 4: separate quiet savings from hopeful savings
- Step 5: keep productivity tied to an operating measure
- Step 6: count the savings HR can see quickly
- Put the model together
- A worked example for a 500-person company
- Beware of giving the platform credit for everything
- Questions to ask before signing
- Beware of red flags in the vendor's ROI deck
- Build the ROI into the contract
Why a good intention won't survive the budget meeting
When HR managers and executive sponsors don't get a technology investment turned into a company-wide win, it's not because they were overly optimistic or hoped for the best. It's because different departments weren't speaking the same language.
For starters, HR and Finance may not have been aware that they were describing the benefits of the technology investment in different "currencies".
When Finance performs financial analyses, if the benefits of a HR investment are not clearly conveyed, then it might just read like a discretionary spend that can be put on the back burner.
On the flip side, if you overstate your benefits - maybe you claim a 300% return on investment based on a cherry-picked case study - you run the risk of an audit that might disprove your tall claims and leave you unsupported.
To address this misalignment, your team can create an agreed upon benefit taxonomy so you're all on the same page. For instance, you may decide that benefits will be categorized in the following ways: cash-releasing benefits (a new contract stops a contractor requirement and reduces overtime), cost-avoiding benefits (we avoid investment in a new tool / A new tool requires no additional staff) and capacity benefits (EFFICIENCY - we'll save time with this tool).
As you create your model, ensure that this taxonomy is incorporated in the model itself. You want it to be front and center, not something that's in the footnotes. This way, when your financial analyst asks you to categorize different benefits within your model, you can highlight to them if you've already identified that "capacity" benefits are 80% of the benefits value.
Treat ROI as a hypothesis that your HR Department, Finance, and your technology vendor agree to test.
To get a really robust ROI, your model needs three components:
- The cost of the entire technology investment
- Information about a baseline (how long the time savings will take to ramp up) with clearly written definitions
- A conservative price for each outcome you anticipate impacting
You'll also need a named owner per metric, so that it's clear who's responsible for each metric on the model.
Plus, you'll need a payback period that aligns with how your company thinks about software investments. How long does it take to get sign off? How long does it take to get funding from the capital budget?
Since SaaS is usually an operating expenditure, not a capital investment, the conversations around that software purchase might differ.
Within this exercise, recognize asymmetries. For instance, your vendor may want to plan for a 36-month contract while new manager behaviors to reduce turnover might take 12-18 months to fully start working. This means you'll be contractually obligated to that investment before you have the data to back up your investment decision.
This might encourage you to negotiate a phased investment plan.
In addition, understand, define, and communicate another asymmetry: The costs are contractual but the benefits are conditional. While your company is contractually obligated to pay for the entire investment cost, whether or not a single manager actually logs into the reporting dashboard is random.
Use your company's typical investment rules as guidance.
Step 1: add up the real cost
Figuring out the total cost of ownership is one of the more straightforward parts of your model, and you should do it first. This not only makes your project look more credible, but it's also where your procurement department will make its most critical contributions.
First, determine what the cost of your subscription is from a few different angles. Does the vendor charge per employee per month or are they flexible with different pricing tiers? Can you reduce your license count mid-contract, or only at renewal?
Do they even let you reduce your license count at all? Is the subscription billed in the local currency or the HQ's currency? What happens to the minimum commitment if your company undergoes a spin off or sale?
These questions aren't hypothetical for a large enterprise. If you're guaranteeing licenses for 8,000 employees and you sell off a business unit with 1,200 employees, you may be forced to pay for those 1,200 employees you no longer have until the next renewal period.
What else do you need from the vendor that might not be included in the a la carte subscription fee?
- Licensing: Subscription fees, minimum employees commitment, additional modules, whether a subscription is charged at renewal. Are their typical renewal fees escalated?
- Setup: Initial set up, configuring the platform, mapping HRIS fields, setting up the reporting hierarchy (this is often where implementations break down since organizations often have more chaotic org trees than they reveal during demos)
- Technical work: Security review, single sign on (SSO) and SCIM provisioning and ongoing management, contracted integrations, testing, hours of IT support
- Recognition funding: How much money do you plan to allocate to spend on recognitions? What's the margin on your fulfillment? How much money is outstanding on your balance sheet from accrued points? What about potential breakage? Or any complements to gross up income if your rewards are taxable?
- Internal labor: What fraction of a full-time employee is dedicated to running the program, administering surveys, moderating comments, running reports, and cleaning your employee data?
- Training time: How many hours will employees put into training? What about managers? Multiply that by the loaded cost of their hours. You may need a second round of training when 20% of your managers transition into new roles.
- Change work: Things like helping employees get used to the new platform, training managers, translating information based on different geographic locations, consulting with works council, and supporting local HR teams
- Exit costs: Site-level raw data export, any overlap if you're planning a parallel run, effort to migrate from your existing system, potential early termination fees
The recognition funding is often the most significant cost in your model and it's very different from your licensing fees. It's a variable cost, an accrued cost, and you need to plan out how unredeemed balances will impact your financial statement.
So don't simply stick it into an existing HR budget just to make it look more affordable or to make your overall platform look cheaper.
If you have a works council, consulting or engaging your council is something you'll need to think about. This is especially true if you're operating in Germany, France, the Netherlands, or the Nordics. This isn't just a checkbox exercise.
It could meaningfully extend your rollout timeline by the tune of a few months.
Investing enough internal time is also important. And locating this time accurately is critical. Remember, this is where most business cases turn a blind eye.
Sure, you might have 1,000 managers spend 45 minutes in training, but that's 750 paid hours of internal time before any of them can access their team reports.
Now that time may be well spent, but it's a cost. And if you don't include it, you can't later justify the hours the platform will save you and your team.
At a minimum, model your program over 3 years.
Step 2: freeze the baseline before you buy
How do you demonstrate improvement if you don't have a credible "before" period?
When you're planning your data collection strategy, be careful that your "before" period doesn't become a "before, during, and after" period.
Avoid this by taking a temperature reading of your key metrics right now (or as soon as you can). Document the source system, date it, and get your Finance team to sign off on how you're calculating the values.
Remember, different ways of calculating turnover rate (e.g., average headcount, beginning headcount, FTE weighted headcount) can lead to significantly different results, especially if your company is going through massive growth or re-structuring.
Capture the following metrics that are relevant to your operating model:
- Voluntary turnover broken down by department, role group (e.g., leadership vs. technical vs. sales), location, and tenure bands (e.g., our turnover rate splits 30% of people who left based on 0-12 month tenure, 45% based on 1-3 years of tenure, 25% based on 3+ years of tenure). Different tenure times have different attrition rates (hazard curves). The attrition rate for the first year is often very different from the third year, so it's important to capture this data.
- How many employees voluntarily left, but how many of those were regrettable? How do you define regrettable turnover (e.g., was it a high performer? Did the employee leave for a role in a similar company?). Make sure this is a repeatable rule, and not something that changes based on the mood of the manager when the employee leaves.
- How many unplanned absence days occurred? How many of those days did you pay replacement cover for?
- Time to fill. Fill rate. Offer acceptance rate. These specific recruitment metrics are key for specific roles that your business case focuses on protecting.
- Internal moves and promotions, and the size of your internal fill rate
- Employee engagement scores or eNPS draw from surveys, including the % of employees who took part and how many comments the survey generated, per number of invited employees
- What percentage of existing engagement actions were followed through on by managers? How many of last cycle's action plans were actually implemented? This is an uncomfortable metric to evaluate, but it's a useful part of your baseline engagement metrics.
- What is the number of relevant safety incidents, defects, customer complaints, or rework hours? What is your average cost per event?
- How much are your company's current spend on software and consulting? When do these contracts end? Are there co-termination clauses?
Where possible, gather 12 months to 24 months worth of data, especially if seasonality, shift patterns, or small teams make data from a short period of time unreliable.
An item that's often overlooked in data collection and business cases, but often regretfully missed, is ensuring the business case is accurate via hazard curve analysis.
For example, if two-thirds of your voluntary turnover occurs within 12 months, your core problem is likely onboarding, clarity of role, and improving hiring accuracy. But your quarterly engagement surveys that only start checking in with employees at the 4-month mark may not see those employees before they exit!
This doesn't mean you can't build a business case. It just means you need to adjust who your business case is for and alter your engagement survey cadence for new joiners.
Additionally, if you're a large enterprise, a blended annual turnover rate may be misleading.
A stable corporate function may pull up the average turnover rate when added to the mix, while a tech team where every turnover is felt can keep the average rate down.
It's important to consider the overall turnover rates and turnover rates per departments or functions.
Then, focus your business case on the latter.
Finally, save all your baseline calculations, assumptions, and rules in a shared document. Make sure it's up to date and that it clearly defines what cost centers and job families are in scope.
Why? Because if your definition of "regrettable turnover" includes different job roles at a contract renewal than it did a contract signing, then it's not really a measurement - it's another re-baselining exercise.
Another smart habit to develop is to record the volatility of your baseline metrics, not just the baseline numbers themselves.
If your quarterly turnover levels have fluctuated between 15% and 21% over the last eight quarters, with zero interventions in place, then a 2-point improvement is already within the noise range.
Step 3: put a price on each avoidable departure
Reducing turnover represents the most defensible value in your impact model, but be careful not to fall into the trap of using one average cost per departure across your entire organization or ignoring non-cash costs.
Using one average cost per departure at the company level either inflates the cost of replacing less expensive roles or undervalues the cost of replacing scarce roles. This is dangerous since your Finance department may pick apart the number and disregard the logic.
When you're calculating your cost, use an estimate based on different costs your organization can track down.
Your recruiting spend includes advertising costs, agency fees, recruiter hours (converted into dollars), hours spent by the hiring panel, costs related to screening and incentives for hiring.
There's also a cost to onboarding new employees, training them, ensuring temporary coverage for the role, overtime costs, and the cost of the time it takes the employee to become fully productive.
Some of these costs may not be marginal so be honest when calculating them. Your internal recruiter's salary is a sunk cost unless a significant volume of hires is required to justify external spending on a recruiter or contractor costs.
Research reviews suggest replacement costs are somewhere between half an employee's annual salary to twice their annual salary.
When it comes to senior-level staff and more scarce specialists, the costs can vary much, much more. Use your own recruitment requisition data instead of relying on industry benchmark data.
Use cost bands instead of one inflated average
You can attribute a certain average salary percentage to your frontline roles, another average percentage to your professional roles, and a higher cost to managers and scarce specialists. At the same time, you can give the cost/contribution when full employee capacity is achieved to highlight your critical function teams.
This allows your Finance team to question specific bands while accepting the broader framework.
Your cost-per-departure calculation may be:
Annual turnover savings = headcount x baseline turnover rate x assumed reduction times average cost per departure
Be mindful of what your use of "assumed reduction" means. This ambiguous point has derailed HR business cases.
For instance, a 2 percentage point reduction from 18 percent to 16 percent isn't the same as a 2 percent reduction in turnover relative to the baseline.
A 2 percentage point from 18% to 16% means 10 fewer departures per year, assuming a headcount of 500.
A 2 percent reduction relative to baseline turnover means you avoid fewer than 2 departures.
Make sure "assumed reduction" is clearly stated in plain language next to the calculation so everyone knows what's meant.
Model small changes - 1 or 2 percentage points in turnover, for example - based on your own year-over-year variation instead of plugging large turnover reductions from case studies into your model.
The exception nobody models: turnover that should go up
Reducing turnover below a certain level can backfire, and no vendor calculator has accounted for this.
Some turnover is healthy. It opens up advancement opportunities for other employees, refreshes teams, and removes employees who aren't a good fit. Drastically reducing voluntary turnover (e.g. 8% to 4%) in a stable corporate function may simply lead to a frozen hierarchy that employees were eager to move up through.
Boris Groysberg, author of Chasing Stars, points out that a person's performance is impacted by the organizational context around them. In other words, a retained employee in a crappy team is not as valuable as a retained employee in a good team.
Step 4: separate quiet savings from hopeful savings
Some of the benefits you may have identified in areas such as reduced absence, reduced overtime, improved safety, and reduced errors and defects will take time to materialize while teams stabilize and managers act on feedback. This will have a longer chain of evidence and produce less money than you might like.
To keep your model grounded in reality, determine whether each of these benefits will be cash-releasing or notional savings, and then only incorporate the cash-releasing impacts into your financial model.
Absence and overtime
To calculate your absence savings, multiply the number of unplanned absences by the loaded cost of these absences (including salary). But remember this only applies to populations where absence impacts the ability of the team to work without paying for replacement workers. In shift-based operations, this is a real cash cost.
But for some salaried professionals, the impact of an absence may be negligible if the work can be easily distributed to other team members.
This means the organization shouldn't count absence savings in instances where workers don't have to be replaced with paid employees. This will keep your calculations from being discredited.
You can find the baseline data on absence in your payroll or workforce management system.
Meanwhile, a number of studies have shown an association between higher employee engagement and lower rates of absenteeism. For instance, according to Gallup data, more engaged teams have lower rates of absenteeism.
While this is an invaluable data resource, it's important to note that this is an association at the business-unit level. It's not a guarantee that your employee engagement platform is the reason for a drop in your organization's absentee rates. So when you use this information, it's best to offer a conservative range and ask for a comparison group to be evaluated for a more accurate understanding.
The same considerations apply when you're calculating a decrease in overtime.
If your organization is using overtime to compensate for vacancies, high rates of employee absence, or complex rostering, then a reduction in overtime may be a significant benefit.
But if your overtime is related to demand spikes or a structural under-staffing of the organization that's out of the scope of your employee engagement platform, then it won't be relevant.
In addition, make sure the causation is clear. For an understaffed area, overtime and absences can exacerbate each other. They may both be a sign that more employees should be hired, a decision that lies with someone two or three levels above the manager implementing the plan.
Presenteeism, safety, and errors
Presenteeism - the act of showing up but not doing much while at work - is a real issue. But it's one of the fastest ways to discredit your ROI model, since a small percentage applied to a total payroll equals a big number that no system can verify and no manager can be held accountable for.
Yes, people do show up and not do as much when they're burnt out or disengaged.
But it's best to put this in your "upside not counted" column unless you have data that measures productive capacity in a way the business trusts.
Similarly, if you want to analyze safety and quality, use the operating measures that your leaders already understand and review in their monthly reports.
These could include recordable incidents, product defects, medication errors, failed inspections, customer complaints, or hours of rework. Focus on the metrics your organization knows the unit costs for.
There are large research datasets that find an association between employee engagement and safety or quality outcomes, but these studies show a lot of variation in the effect of engagement on safety and quality depending on the work setting.
So when your safety or quality improves, calculate the value of the improvement using your own average cost per incident or average cost per rework event.
Be aware of one potentially perverse effect when using safety data. A company that improves psychological safety by engaging in employee engagement activities and therefore changes people's comfort level reporting incidents may see a rise in recorded incidents or near misses in the first year following the interventions. This data would suggest a deterioration of safety in your ROI calculations when in fact it's an improvement due to better reporting.
To avoid this, consider breaking out your report into the rate of reports and the severity or lost time cost of these reports.
Step 5: keep productivity tied to an operating measure
Productivity gains tend to produce the largest number in the vendor calculator and the smallest (or questionable) number in Finance's review.
What do we mean?
Well, the common approach is to take an assumed percentage improvement and apply it to total payroll to compute productivity recovered.
The problem with this approach is that recovered productivity is an intangible number that's hard to observe and attribute. It also causes confusion among finance teams - if this increased productivity has any value, which cost center's budget are we supposed to reduce?
Instead, select an operating measure (KPI) the business already reports on and that someone already owns.
- Sales teams: Gross margin per representative or % of quota met (instead of % of pipeline)
- Customer support teams: Number of cases resolved per paid hour, number of first-contact resolutions, number of repeat contacts
- Operations: Number of units produced per paid hour, rework rate, completion on time
- Professional services: Realized utilization, write-offs (instead of billable hours recorded)
For example, suppose your customer support team handles around 100,000 cases a year, and you anticipate a modest 1% improvement in the number of cases resolved with no additional staff.
That means you can resolve an additional 1,000 cases.
You then value that output either by the cost of the additional capacity you won't need to hire or by some other function your Finance team can link to a headcount plan.
If you're looking at a sales team, make sure you convert the additional revenue into gross margin before valuing it as a benefit.
This is important because not all revenue translates into profit.
Plus, your CFO is likely to remember the difference.
Studies led by researchers at the University of Oxford have found the positive association between employee well-being and productivity.
But that doesn't mean you can plug those numbers into your own headcount and get your answer. Remember: these studies are drawing general conclusions. They're not tailored for your industry or business.
Measuring the impact of employee engagement or well-being is complicated, especially since it can't fix everything. It can't instantly remedy broken processes, a structurally understaffed operation, or a manager who's never had training on effective team communication.
Here's a cautionary tale. Jeffrey Pfeffer and Robert Sutton point out in Hard Facts, Dangerous Half-Truths and Total Nonsense that organizations often adopt practices because everyone believes they work, not because the evidence suggests they do in that specific context.
A big risk of creating an ROI model is that it encourages you to justify a decision you've already made, so you end up doing exactly that.
How do you avoid this?
Ask yourself if you'd accept your ROI model if it produced a negative number.
| Weak approach | Defensible approach |
| Assume that your engaged employees produce 3% more and apply this 3% to your entire payroll. | Assume a small change in your teams' operating measures (which they're tracking) and then measure the observed output and value it at your output margin either = increased output or avoided capacity cost. |
| Assume you'll have the benefit of that productivity improvement spread throughout the entire company from day one. | Apply the metric only to the teams where you've actually rolled out your program, reviewed the results, and logged completed actions - with a lag of a quarter. |
| Use the benchmark provided by the vendor as your expected case | Use your own historical data on year-over-year variation, and keep your vendor's benchmark for the optimistic case |
| Assume you can attribute the increased output to any team | Attribute the increased output only to the teams where capacity is a constraint (i.e. if you can add more capacity but the team is already running at full speed to meet customer demand, that is a valuable benefit) |
Step 6: count the savings HR can see quickly
Some savings are easy to generate and don't require any changes in employee behavior. This is a great way to build the backbone of your conservative business case.
Start by listing the survey tools, employee recognition systems, consulting contracts, reporting services, manual processes, and other functions that your new platform will replace. This includes your current annual employee engagement survey vendor and the number of days your team uses this analyst.
Next, confirm whether your organization can actually end these contracts and when.
Do you have existing licenses or contracts with a survey tool that have 18 months left on them? Is your engagement survey vendor part of a larger suite agreement that's up for renewal on a specific date? These details will determine when you can actually realize these anticipated savings.
You should also be on the lookout for other tools or processes that may impact your anticipated savings. For instance, did another division purchase a pulse survey tool using corporate credit? Can a specific employee recognition system be managed within the budget of a particular plant?
Did you previously hire a consultant to assist with your leadership survey every other year? These activities may not be listed in your corporate software inventory, but they can wind up being the most impactful, tangible savings within your business case.
Another critical source of savings is administrative hours. But here's where many HR business cases lose credibility with Finance.
For instance, while automated reporting might save your HR department 500 hours annually, it doesn't mean your department can recoup that time in the budget.
You can only count those saved hours as cash savings if they allow you to eliminate contractor spend, a requisition you can formally cancel, or paid overtime.
On the other hand, if your HR team uses those saved hours to focus more on analysis or coaching managers, then it's important to count that as increased capacity or effectiveness.
Put the model together
Now that you have all of the above, it's fairly straightforward to put the parts together. It's basically:
ROI % = (total annual benefit − total annual cost) ÷ total annual cost × 100
Keep in mind that you want to calculate your average payback based on cumulative cash flow over the months, not annual average divided by 12.
If you want a quick estimate, divide the upfront cash commitment by the expected monthly net benefit.
Then, slowly build it month by month back based on when you'll get invoices, roll out the program in different waves, and when you expect behavior change to impact lagging metrics.
Make sure to put together 3 scenarios:
- Conservative: Retirement of contracts, displaced spend, but almost no behaviour change
- Expected: Movement within your historical year-on-year metrics range within the launched populations
- Optimistic: Strong adoption and success producing metrics close to external benchmarks
Then, add an adoption factor for each benefit that's dependent on people using the platform. The benefit of your program may be having "x" number of employees, but the experience change may require a series of events: going from invited employees to employees that respond to manager that views report to manager that agrees on action to actions that get completed.
When you multiply this chain of events by your intended adoption rate, you usually land at a figure far less than 50% (perhaps less than 20%). This compounding effect often leads to a major difference between vendor ROI models and actual results.
This is an important metric for knowing what you want your program to focus on improving during implementation.
At this point in the process, it's useful to understand your model's sensitivity to different values. Change your major issues one by one. When do your conservative outlook numbers turn negative?
Often it's something like cost per departure (or cost per contract with a vendor) or the adoption chain that causes this, not the license fee.
This gives you an answer to "what would have to go wrong?" Your CFO likes to hear what your risks are. Is your strategy to get a better contract? To implement better metrics?
To conduct monthly reporting on it. Great.
If it's a multi-year contract, calculate the NPV using your Finance team's usual discount rate.
Push back some benefits if you can't sustain them until year 2. Factor in all escalators (e.g., agreed price increases) instead of assuming the license fee will stay flat.
You want to make sure that your conservative case meets an expectation of breakeven within 18 to 24 months.
Your organization may have different rules for a project to go ahead. There's a debate among practitioners about how much investment in behavior changes should be supported by hard cash savings. Decide what your rule is and clearly state it at the start.
At Sparkbay, we work with large companies to turn an engagement business case into measurable metrics 12 months after launch.
Our main metric is an engagement score out of 10, collected on a recurring basis. So if one business unit starts showing different results, you can see that within weeks rather than waiting to have it averaged out over the next annual report.
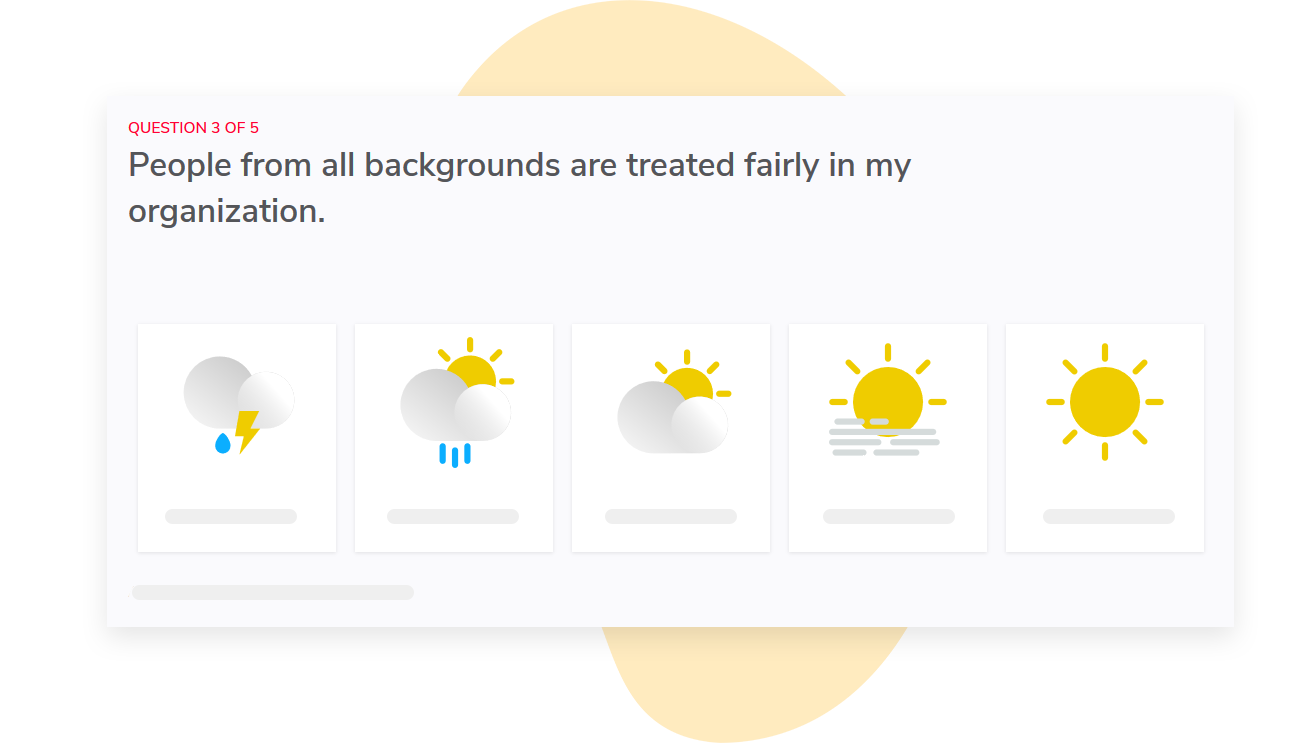
It is customizable to your company. You can change the survey questions and dashboard contents. This is important for an ROI model.
If you base your business case on certain items, you want to ensure they are identical during the baseline period and the re-negotiation period.
So if your business case includes manager support, workload, or intent to stay, you can lock those questions in, keep the questions the same throughout each wave, and compare them to the baseline period you agreed on before signing the contract.
As well, averages at the company level can easily mask the driving factors behind your success or lack of success.
Sparkbay allows you to break down your results by manager, department, tenure, and other customizable groups. We also keep your data confidential and secure by hiding results if the response threshold isn't met (5 by default, customizable).
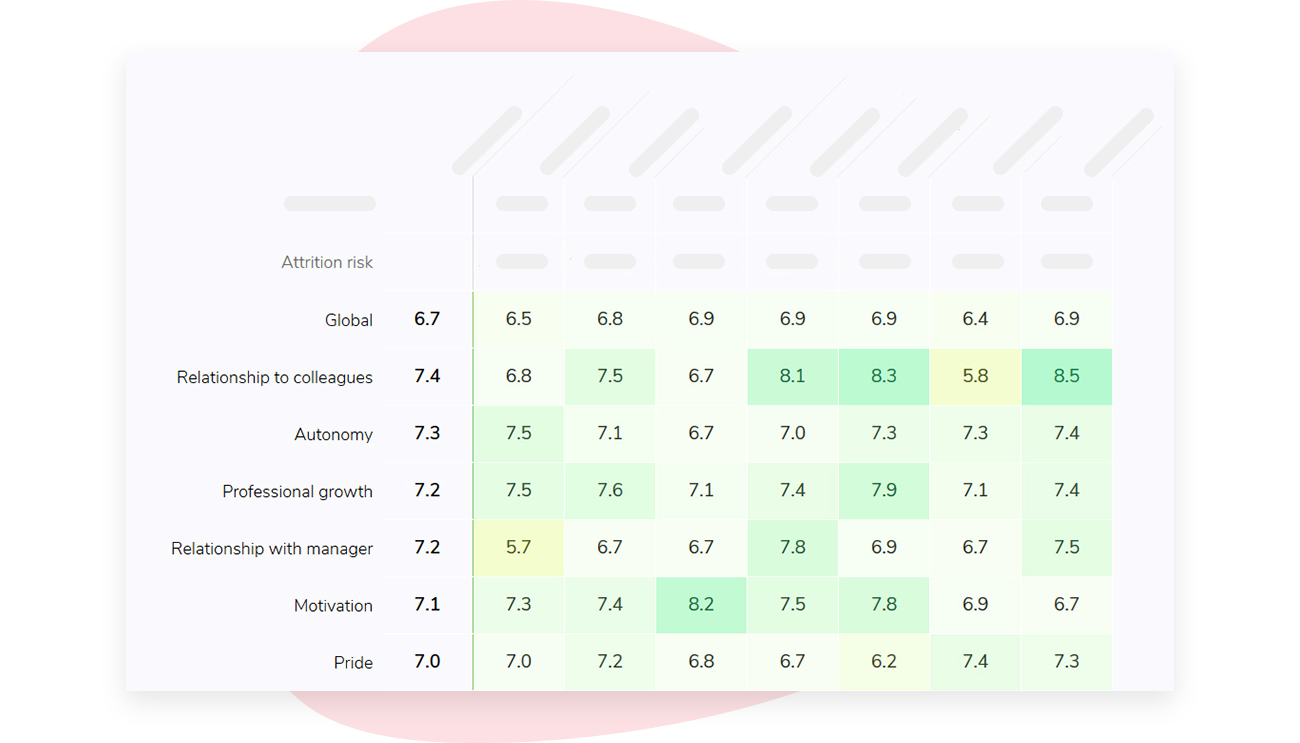
Manager's report access is automatically mapped to the reporting structure within your organization, so managers only see their teams' data, not the entire company's data. That also streamlines your security review, since Sparkbay is ISO 27001 certified.
This reporting structure could facilitate a phased roll out by allowing HR to compare roll out groups to non-roll out groups without providing access across the organization.
If you're interested in learning how Sparkbay can help you build a more engaged workforce, you can click here for a demo.
A worked example for a 500-person company
In this section, we walk you through a simplified, illustrative example, using the same planning assumptions and fictional currency units as the rest of this document.
Please note: This is a worked example and not based on Sparkbay pricing or any market benchmark. It's simply meant to help you understand how you can plug numbers into your own spreadsheet.
Let's say your company has 500 employees.
Voluntary turnover rates over the past years have been 18%.
Your average loaded cost per employee is 70,000 currency units.
You take a look at your company's own requisition data to decide on an average cost of departure (including cost to recruit, onboard, cover vacancy, and get a replacement employee up to speed).
You decide, based on your data, that this average cost is 35,000 currency units.
This amount is roughly half the average loaded cost per employee, putting you on the conservative end of estimates we've published.
Let's suppose your company is on the conservative side, and you think your employee turnover will only decrease from 18% to 16%.
This means you'll avoid 10 turnovers, saving your company 350,000 currency units in avoidable turnover costs.
| Costs Year 1 | Illustrative Amount |
| Platform license | 80,000 CU |
| Implementation and Configuration | 25,000 CU |
| Funding Recognition | 50,000 CU |
| Internal program and IT time | 45,000 CU |
| Time to train managers and employees | 35,000 CU |
| Total cost in Year 1 | 235,000 CU |
Suppose your company also forecasted that your platform would reduce unplanned absences by 0.5 days per employee.
This forecast applies only to the 250 people on your team who work in shifts, for whom unplanned absences result in the paid time of a backup employee.
Assuming the average loaded cost per day per employee is 280 currency units, your company would estimate a saving of 35,000 currency units.
In addition, let's assume 2 other subscriptions/tools your company uses expire during year one, resulting in a further saving of 25,000 currency units.
Your HR team anticipates recovering some of the administrative time spent on HR projects, but they plan to use this time to work on other initiatives, not reduce their budget. So your team doesn't count this as a cash benefit.
| Conservative Annual Benefit | Illustrative Amount |
| 10 avoided turnover | 350,000 CU |
| Reduced unplanned absences | 35,000 CU |
| Retire Tools | 25,000 CU |
| Administrative capacity gained | Not counted |
| Total Benefit counted | 410,000 CU |
You can now calculate your conservative Year 1 ROI as approximately 74%.
This figure comes from total benefit (410,000) minus total cost (235,000) divided by total cost (235,000).
Assuming all of the year-one costs are cash outlays and that the project's net benefit is spread out evenly each month, you can determine a payback period. Your payback period is roughly 14 months.
Keep in mind that in reality your payback period might be longer or shorter, since you'll likely pay the majority of your costs up front, but the savings from avoided turnovers will be realized over time. This is why we suggest you model your costs and benefits on a monthly basis.
| Scenario | Annual benefit | ROI | Approximate payback |
| Conservative | 410,000 CU | 74% | 14 months |
| Expected | 575,000 CU | 145% | ~8 months |
| Optimistic | 775,000 CU | 230% | ~5 months |
At recurring annual costs of 210,000 currency units and a discount rate of 8%, your 3-year NPV under the conservative scenario is about 490,000 currency units.
Again, this is an illustrative exercise to help you use your spreadsheet.
Suppose you took a more conservative approach. You estimated average cost per turnover at 25,000 currency units instead of 35,000 and your implementation plan and adoption strategies only reached half your population effectively. Your annual benefit from avoided turnovers would decrease to around 125,000, making your conservative scenario negative in Year 1.
By challenging your assumptions and considering different scenarios, you can identify the factors most critical to your project's success.
Beware of giving the platform credit for everything
Remember that turnover may have improved for reasons unrelated to your platform such as a compensation review, hiring freeze, and a popular (and well-liked) leader walking in back out the door. It may even be the external market cooling down and less people calling your team.
When it's time to assess your technology and conduct another renewal review, consider these factors as best as you can to ensure your platform isn't given too much credit.
One of the most affordable ways to identify the impact of your HR software is through a staggered rollout.
Instead of rolling the platform out for the entire organization at once, roll it out for two divisions. Hold off on rolling it out for the other divisions for a few months.
After a few months, you can assess the differences in improvements in the divisions where the platform was rolled out against the divisions where it wasn't rolled out.
This approach applies difference-in-differences methodology. While it sounds complex, it's a pretty straightforward approach that doesn't require a full data science team to perform.
When you do apply this approach, it rests on the assumption that the divisions had similar "pre-trends". This means you should confirm that the divisions experienced similar issues or were trending in similar directions before the platform rollout.
Selecting divisions that are experiencing a positive trend to compare with divisions experiencing negative trends - let's say of the past four quarters - isn't a great comparison. And if you can't find comparable pre-trends, it's worth highlighting that instead of recombining trends.
You should also be mindful of that selection bias working the other way as well.
Your best divisions may be the ones most willing to embrace a new platform because they already prioritize one-to-one meetings and follow-ups.
As a result, high usage levels may be more a symptom of your divisions being well-managed rather than the reason why your division is well-managed. It could make your scatter plot of usage versus positive outcomes look impressive while producing misleading results.
The partial solution to this problem is to randomly select your pilot divisions for the new platform rollout instead of giving in to the request to "start where there's energy" and "let's start with our biggest fans".
Otherwise, you'll have a fabulous pilot project and an awful comparison.
There's another trap that's worth noting. When workers leave, they stop answering your regular surveys. The folks most likely to leave your organization drop out of your panel and your current intent-to-stay score may artificially increase.
Pay attention to your response rate alongside your tenure band and response rate. If you have a rising intent-to-stay but your response rate is plummeting, then this is a cause for concern.
This research on employee voice supports an important point that Amy C. Edmondson makes in her book, The Fearless Organization. That people are more likely to share useful intel with their organization when they feel safe and when they think they have a responsible listener.
Which suggests a big caveat for your data model. If people participate in the survey and nothing happens, they're more likely to drop off in wave 2 or wave 3 of your surveys. This impacts the effectiveness of your survey and potentially wrecks an important part of your business case.
On top of that, the people who are most critical and disengaged from the survey are more likely to drop off first, skewing your data and making it look better even as it becomes less useful.
To avoid double counting, beware of 3x benefits!
One retained specialist doesn't mean you can claim a full business savings in turnover and a full business savings in recruiting and a full business savings in productivity.
For starters, your recruiting and onboarding costs should already be accounted for in your cost per departure. Make sure you aren't double counting those savings by also counting it as a talent acquisition efficiency!
If your cost of departure already includes output loss while a position wasn't filled, then be sure to remove that from your productivity line.
This concept is important not just when calculating line-items but overall as well. If your company has done a cost-benefit analysis of other systems and tools, be sure to check there's no overlap. For instance, if your company conducted a cost-benefit analysis of your ATS platform last year and already accounted for the business savings of decreased time to fill on the same job requisitions, asking Finance to keep that in the bank twice isn't going to go over well.
Maintain a benefit register that includes the source system, owner, formula, etc.
Questions to ask before signing
A vendor confident in their results will be willing to have an open discussion about potential challenges with customer adoption. Beware of anyone who quickly changes the subject.
Ask your vendor:
- What is the median result (not the average) for customers similar to us in terms of industry and workforce composition?
- What percentage of customers renew after the initial contract? What feedback have customers historically provided if they choose not to renew?
- How do you define "active use" when customers reach month 12? Can you show us the distribution of "active use" across manager levels?
- Can we speak to a customer who did not meet their initial objectives?
- What is not included in the price we were shown for the 3-year period? (e.g., escalations, true-ups, translation, additional waves, different levels of support)
- What are the internal factors that will support successful implementation of this platform? Where do you most commonly see these factors missing?
- What are common trends that lead to stalled adoption by the third wave?
- Is there an option for part of the commercial agreement to depend on meeting agreed leading-indicator thresholds?
- What data can we take with us if we choose to terminate? Can we export raw data at the item-level? Can we export aggregated reports? What formats will these be in? What is the cost, if any, for these exports?
- How many person hours per week will the implementation project require from departments like HR, IT, managers, and internal communications for each wave?
The most critical questions are to speak to a reference that did not meet their goals and to hear what internal conditions are required for successful implementation. If your vendor presents polished answers for these questions, it's likely that you're being sold to rather than evaluated.
Finally, ask your vendor what the "average manager" does in their platform during a typical month.
Beware of red flags in the vendor's ROI deck
Be wary if your vendor makes it difficult for you to adjust key assumptions in a benefits calculator.
This is especially true if you can't easily amend the adoption rate (how many managers will use the product), or the cost per departure (how much turnover is actually costing you).
You also want to be careful if your vendor doesn't let you adjust your assumptions if your benefits are expressed as a percentage of total payroll.
Other red flags include:
- Case studies that don't include a baseline, timeframe, or the number of employees using the product
- "Up to" statements tied to every result
- Promises of payback within a certain amount of time when managers haven't had a full cycle to use the product
- A failure to include the budgeted cost for recognition and its accrued liability
- A push towards a 3-year commitment with no phased rollout or exit strategy
- A focus on productivity or employer brand as the key benefits
- No assumption about the level of adoption in the economic model
- References to customer averages with no median, range, or number of customers provided
- A commissioned, economic-impact study that uses data from a "composited organization" rather than real companies you may recognize
Vendor-funded studies are not useless, but you should look carefully at the sampling frame and how comparison groups were created.
Asking currently-successful customers of your vendor to participate in a survey doesn't provide a representative sample of how a typical rollout in an organization like yours would perform.
Pay special attention to economic-impact studies that use composited organizations. These studies may combine interviews with willing reference customers to create a composite organization and then derive specific benefits for them with decimal precision.
You should take these economic-impact studies with a grain of salt. While you can use them to understand the categories of costs and the economic mechanism for how change happens, you should disregard the headline economic benefit percentage.
Build the ROI into the contract
You don't want your business case to evaporate the moment Procurement starts asking questions.
Incorporate your baseline values, the specific measures you're targeting, when these measures will be assessed, and who within your organization is responsible for them into your implementation plan or a contract addendum. This way, when it's time to discuss renewals, you can revisit agreed-upon numbers.
Ask for an initial phase that gives you the ability to opt out before the entire organization is onboarded.
You want to ensure that this opt-out clause corresponds with when you'll have evidence you can actually access. An opt-out clause based on evidence of a change in turnover within 9 months is meaningless if you won't actually have that evidence until later.
Instead, base your opt-out clause on key leading indicators that you'll be able to observe, such as participation by a specific employee wave, access to manager reports, and completion of specific action items.
You can also negotiate ramped pricing based on the number of employees onboarded instead of a simple discount.
This protects you if there are changes in your timeline for onboarding specific employee waves.
Your success criteria should touch on both leading indicators and lagging business results. Lagging business results may be outside of your vendor's control within the first year.
Helpful success criteria include: activation, participation by a specific wave of employees, access to manager reports, completion of action plans, completion of specific actions, and the ability to re-engage employees in subsequent cycles.
If a vendor promises that you'll see a turnover improvement in the first 30 days, be wary. This is not a realistic timeframe.
You'll also want to negotiate a capped escalation clause and define how the pricing will change if you add more employees. Will the number of employees matter if you decrease your workforce?
You'll also want to ensure that the data ownership is clearly defined, that you have the ability to access certain data, and that the data is only accessible if a certain level of anonymity is met (and who can change this anonymity threshold). You'll also want to define data sub-processing, data retention, and data deletion post-termination.
This is also an opportunity to ensure that the data processing agreement aligns with what you were promised during the sales process and that the scope of security certification covers the service you're purchasing, not just one function within the vendor's business.
Before signing the dotted line, you want to confirm you've identified an executive sponsor and the internal lead for the program, within which you've explicitly noted the number of full-time employees that will be dedicated to the program.
Use the first 12 months to prove or pivot your model
At the end of Day 0, you should have locked in your baseline and distributed all 3 scenarios to Finance and your sponsor. This way, if someone later only remembers the most optimistic scenario, you've already given them the others.
At Day 30, you'll want to check in on your activation and access.
At this point, it's okay to remind stakeholders that we're still in the "plumbing" phase and we might not be adding a ton of value just yet.
At Day 60, you'll want to review manager participation, how responses are distributed, and whether teams have selected actions based on their specific results or generic actions.
At Day 90, you'll want to compare cohorts that have launched with those that aren't yet live and identify departments where little progress has been made.
Reach out to managers in these departments to understand their challenges before assuming there's resistance.
Common issues are span of control, lack of hierarchy mapping, no time allotted in their operating rhythm, or not enough confidence that their numbers accurately reflect their team.
Each of these issues has a different solution, and only the last is a problem related to your platform.
At Month 6, you'll want to review your quicker metrics including absenteeism, intent to stay, and internal mobility which can all be leading indicators of turnover by several months.
At Month 12, it's time to re-calculate all of your previous formulas using your observed costs and observed benefits based on the definitions you locked in earlier.
This is when you'll attribute why your Return on Investment is different than expected. Was it because of adoption? Cost?
Timing? Or an incorrect assumption? Each answer leads to a different adjustment.
Only one should lead to scrapping the entire model.
Throughout this time, unquantified benefits should remain in their own bucket and any top-line capacity benefits should be reported separately from cash benefits.
Turnover is a lagging metric, so if your 90-day attrition number remains flat, it's not necessarily a reason to cancel your program - especially if you've properly set expectations.
By the time it's renewal time, you should be able to say which assumptions worked, which didn't, and what you would tweak in your model instead of stubbornly clinging to the original numbers.
If you're interested in learning how Sparkbay can help you build a more engaged workforce, you can click here for a demo.