On this page
- Introduction: why yesterday's data is today's goldmine
- Setting the stage: what apples to apples really means
- Internal benchmarking: racing against your past self
- External benchmarking: how do you stack up against the pack?
- The numbers game: metrics that actually matter
- Reading between the lines: spotting trends, not just blips
- Visualizing the journey: dashboards that tell a story
- From insights to action: closing the loop
- Common pitfalls: mistakes that muddy your data
Introduction: why yesterday's data is today's goldmine
The survey results land in your inbox on a Tuesday morning, right between a budget meeting and a note from a manager worried about turnover on her team.
At first glance, the numbers look fine: engagement is steady, participation is respectable, and a few scores have moved up or down by a point or two.
But as an HR leader, you know the real question is not, "What did employees say this time?"
The better question is, "What has changed since the last time we asked?"
A single employee engagement survey gives you a snapshot of how people feel in one moment, shaped by everything from leadership changes to workload spikes to the mood of the business that quarter.
Longitudinal data tells a deeper story because it shows whether trust is growing, burnout is spreading, managers are improving, or employees are slowly disconnecting before anyone says it out loud.
When you compare and benchmark survey results over time, you move from reacting to isolated scores to recognizing patterns that can guide better decisions.
You can see whether last year's action plan worked, whether one department is drifting from the rest of the organization, and whether your engagement strategy is keeping pace with employee expectations.
In this guide, you'll learn how to compare results fairly, benchmark against both your own history and external data, identify meaningful trends, and turn those insights into focused action.
Because yesterday's survey is not old news; it is the baseline that helps you understand what your workforce is really trying to tell you today.
Setting the stage: what apples to apples really means
Longitudinal engagement analysis depends on one deceptively simple condition: the organization must be measuring the same construct in a comparable way over time.
Changing a question from "I receive useful feedback from my manager" to "My manager gives me recognition and feedback" may look minor, but it blends two different constructs into one item. The resulting trend line becomes harder to interpret because any movement could reflect feedback, recognition, wording effects, or all three.
Apples-to-apples comparison rests on four forms of consistency:
- Question consistency: Core survey items should remain stable across cycles.
- Scale consistency: A 5-point agreement scale, 7-point scale, 10-point scale, or eNPS scale should not be swapped without a conversion plan.
- Timing consistency: A survey sent in January after year-end bonuses may produce different sentiment than one sent during peak workload or restructuring.
- Population consistency: Results should account for major changes in workforce composition, acquisitions, divestitures, or large hiring waves.
The best approach is to establish a stable core survey that anchors trend analysis. This core should include the engagement outcome measures and the main drivers the organization expects to manage over several years, such as manager effectiveness, enablement, belonging, recognition, workload, growth, and confidence in leadership.
That does not mean the survey can never evolve. Mature listening programs usually combine a stable core with a rotating module for emerging priorities, such as hybrid work, AI adoption, career pathways, or change readiness.
When survey questions must change, preserve continuity wherever possible. Run old and new items side by side for at least one cycle, document the change, and avoid presenting the new item as a clean continuation of the old trend unless the constructs and scale are genuinely comparable.
Internal benchmarking: racing against your past self
Internal benchmarking compares current engagement results against the organization's own historical performance. For large organizations, this is often more operationally useful than external benchmarking because it reflects the company's own culture, structure, labor market, leadership model, and operating constraints.
The most common internal benchmarks include prior survey cycles, annual baselines, business-unit averages, high-performing teams, and enterprise-wide norms. Each benchmark answers a different question.
| Internal benchmark | Question it answers | Best use case |
|---|---|---|
| Previous cycle | What has changed since the last measurement? | Pulse survey tracking and short-term intervention review |
| Same period last year | What has changed year over year? | Controlling for seasonality and annual business rhythms |
| Enterprise average | Which groups are above or below the organizational norm? | Prioritizing support across functions, regions, or leaders |
| Top-quartile internal teams | What does strong engagement look like here? | Identifying internal practices worth scaling |
| Pre-change baseline | What happened after a restructuring, merger, or leadership change? | Evaluating organizational change impact |
Tracking eNPS, participation rates, engagement index scores, and category scores over time creates a practical baseline. Yet the most valuable signals often appear when HR segments those trends by department, manager, tenure, location, job family, work arrangement, or employee demographic group where legally and ethically appropriate.
A company-wide engagement score that moves from 7.3 to 7.4 may look uneventful. Underneath that average, early-tenure engineers may have dropped by 0.8 points, frontline managers may have improved sharply, and one region may be showing a sustained decline in trust.
Large organizations should be especially cautious about averages because they can conceal polarization. A stable mean score can mask a growing split between highly engaged employees and employees moving into neutral or unfavorable territory.
Meaningful change should be judged through statistical, practical, and organizational lenses. A small shift may be statistically significant in a large population, but not operationally meaningful; a larger shift in a small but critical group may warrant attention even if it does not meet a strict significance threshold.
External benchmarking: how do you stack up against the pack?
External benchmarking compares engagement results against organizations outside the company. Used carefully, it helps HR and executives understand whether internal scores are strong, weak, or typical relative to the market.
Reliable benchmarks usually come from survey vendors, industry consortiums, professional associations, academic datasets, or large-scale workforce research. The most useful benchmarks are recent, industry-specific, regionally relevant, and based on similar survey items and scales.
External comparisons are especially valuable when leadership needs context. A score of 7.1 out of 10 on "confidence in senior leadership" means little on its own, but it becomes more actionable if the organization knows whether comparable companies average around 6.5, 7.0, or 8.0.
External benchmarks also support priority-setting. If career development is low internally and also low across the industry, the organization may still choose to improve it, but the interpretation differs from a scenario where the company is significantly behind peers.
There are limitations. Competitor benchmarks may not account for differences in workforce composition, economic context, unionization, job design, geography, or organizational maturity.
Benchmark obsession creates its own risk. A company can be above benchmark and still have an engagement problem if scores are declining, attrition is rising, or employees are sending clear qualitative signals that trust is weakening.
The strongest use of external benchmarking is diagnostic rather than performative. It should sharpen interpretation, not become a scoreboard that crowds out internal reality.
The numbers game: metrics that actually matter
Engagement measurement can become cluttered when HR teams track every available number with equal weight. The better approach is to define a focused measurement architecture that distinguishes outcomes, drivers, and diagnostic indicators.
Outcome metrics show the overall state of engagement or attachment to the organization. Driver metrics explain what may be influencing that outcome.
Common outcome metrics include engagement index scores, eNPS, intent to stay, pride, discretionary effort, and recommendation likelihood. Common drivers include manager quality, trust in leadership, role clarity, recognition, workload sustainability, career growth, inclusion, and enablement.
HR teams should also decide how to read the underlying response pattern. Mean scores, favorability scores, and distribution shifts each reveal something different.
- Mean score: Useful for trend tracking and ranking, especially on 5-point, 7-point, or 10-point scales.
- Favorability: Shows the percentage of employees selecting positive responses, often easier for executives to interpret.
- Neutral rate: Can reveal uncertainty, hesitation, or lack of conviction before negative sentiment becomes explicit.
- Unfavorability: Helps identify concentrated risk, especially for items related to burnout, trust, or intent to stay.
- Distribution movement: Shows whether scores are improving broadly or whether changes are concentrated among specific groups.
Statistical significance matters, but it should not be treated as the only standard for action. In large enterprises, very small differences can become statistically significant because the sample size is high.
Practical significance asks a different question: is the change large enough to matter for decisions, employee experience, or business outcomes? Many organizations use internal rules of thumb, such as flagging movements of 0.3 to 0.5 points on a 10-point scale or 5 percentage points in favorability, but the right threshold depends on sample size, scale design, and survey history.
Response rate is another signal that deserves close attention. A declining participation rate may indicate survey fatigue, low trust that action will follow, confusion about anonymity, or simply poor timing.
Participation trends should be reviewed by segment. If overall participation is stable but one function, location, or tenure group stops responding, that silence may be as important as the scores themselves.
Reading between the lines: spotting trends, not just blips
Engagement data becomes strategic when HR separates sustained movement from one-time volatility. A single decline may reflect a recent event; a three-cycle decline often signals a deeper pattern.
Context is critical. A reorganization, acquisition, return-to-office mandate, compensation change, leadership transition, hiring freeze, or public business setback can all shape employee sentiment during a survey window.
The goal is not to explain away the data. The goal is to interpret it with enough context that action is proportionate and targeted.
Rolling averages can help smooth volatility, especially for monthly or quarterly pulse surveys. Instead of overreacting to one low month, HR can examine the average of the last three or six cycles to identify the direction of travel.
Multi-period comparisons are also useful. For example, comparing current results against the previous pulse, the same quarter last year, and the pre-intervention baseline can reveal whether a movement is temporary, seasonal, or linked to a specific action plan.
Some early warning signs deserve special attention because they tend to precede more visible business impacts:
- A gradual decline in confidence in leadership across several cycles.
- Falling scores for workload sustainability paired with stable or rising performance pressure.
- Lower intent to stay among high-tenure employees or critical job families.
- A widening gap between managers' self-perception and their teams' feedback.
- A rise in neutral responses on questions about belonging, recognition, or career opportunity.
- Participation declines in groups already showing below-average engagement.
Text comments can clarify whether a score movement reflects a specific irritant or a broader shift in employee sentiment. If recognition scores fall, comments may reveal whether employees are reacting to manager behavior, compensation decisions, promotion practices, or lack of visibility from senior leaders.
For large organizations, the most important trend may be the spread between segments. A widening gap between corporate and frontline employees, headquarters and field teams, or new hires and long-tenured employees can indicate that the employee experience is fragmenting.
Visualizing the journey: dashboards that tell a story
Engagement dashboards should help leaders identify where attention is needed, not bury them in charts. The best dashboards combine trend direction, magnitude, segmentation, and context in a format that supports decisions.
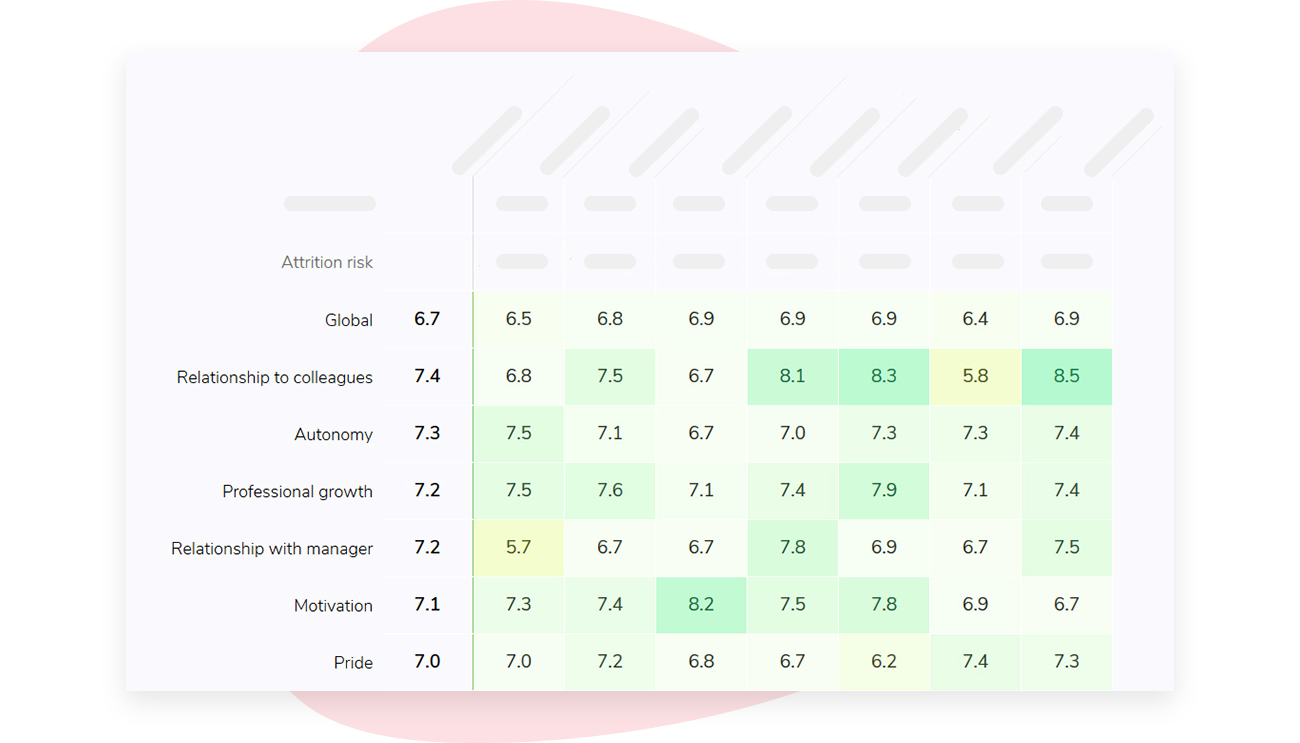
Trend lines are useful for showing movement over time. Heat maps are useful for spotting differences across departments, managers, locations, or demographic groups.
Comparison tables work well when leaders need to see current score, previous score, change, benchmark, and sample size in one view. They are especially helpful for executive teams that need to prioritize across many business units.
A strong dashboard should make three questions easy to answer:
- Where are we improving?
- Where are we declining?
- Where are we meaningfully different from our benchmark?
Visual design matters because leadership attention is limited. Use consistent colors, avoid excessive decimals, show sample sizes, and distinguish between statistically meaningful movement and routine fluctuation.
For employee-facing communication, simplify even further. Employees usually need to know what was heard, what will change, who owns the action, and when progress will be reviewed.
Platforms such as Sparkbay can reduce the manual work involved in trend tracking by keeping survey cadence, reporting, segmentation, and benchmarking in one place. That consistency is especially valuable when HR is managing recurring pulses across multiple departments, managers, and locations.
How Sparkbay can help you compare and benchmark engagement results over time
Sparkbay supports longitudinal engagement measurement by automatically collecting employee feedback at regular intervals. Many clients run monthly pulse surveys, which gives HR teams enough frequency to detect movement early without relying on a single annual snapshot.
After each survey, Sparkbay presents results in intuitive reports with a clear score out of 10. That makes it easier to track whether engagement, manager effectiveness, recognition, workload, or other key drivers are improving, declining, or staying flat across cycles.
For benchmarking, the value comes from moving beyond a single organization-wide average. Sparkbay lets teams segment results by manager, department, tenure, and other attributes, so HR can see whether a trend is broad-based or concentrated in a specific part of the organization.
Sparkbay also allows companies to benchmark against organizations in their industry using Sparkbay's proprietary dataset. That external context helps leadership understand whether a score is genuinely lagging, relatively strong, or aligned with market norms.
Once the priority areas are clear, Sparkbay offers a library of easy-to-implement actions that managers can use to improve. This is important because engagement data loses credibility when managers receive scores without practical next steps.
For HR teams running repeated survey cycles, the combination of regular feedback, trend reporting, segmentation, benchmarking, and action support creates a tighter measurement loop. It helps shift engagement work from periodic reporting to continuous improvement.
If you're interested in learning how Sparkbay can help you build a more engaged workforce, you can click here for a demo.
From insights to action: closing the loop
Trend analysis creates value only when it changes decisions. The shift from insight to action should be structured, visible, and proportionate to the data.
Start by separating enterprise-wide priorities from local priorities. A company-wide decline in confidence in senior leadership may require executive communication, strategy clarity, and visible leadership routines; a localized decline in manager feedback may require coaching for a specific leadership group.
Action planning should be tied to the drivers most likely to move the outcome. If intent to stay is falling among employees with two to five years of tenure, career development, internal mobility, and manager career conversations may matter more than broad culture campaigns.
Targets should be realistic. Aiming to move an engagement index from 6.8 to 8.5 in one quarter may undermine credibility, while a focused improvement of 0.3 to 0.5 points on a priority driver may be more attainable, depending on the scale and baseline.
Communication is part of the intervention. Employees need to see that survey findings are acknowledged, interpreted honestly, and connected to action.
A useful close-the-loop message includes:
- What the organization heard.
- What improved since the last cycle.
- What still needs attention.
- What actions will be taken.
- Who owns the actions.
- When employees will hear about progress again.
To demonstrate ROI, HR can connect engagement trends with outcomes such as attrition, absence, internal mobility, safety incidents, customer experience, productivity, or manager turnover. Correlation should not be overstated, but repeated patterns across time can build a credible business case.
Common pitfalls: mistakes that muddy your data
Longitudinal benchmarking can lose credibility when the measurement system changes too often or when leaders overinterpret minor movements.
Survey fatigue is one common problem, especially when employees are asked for feedback frequently but see little action. Pulse surveys work best when they are short, relevant, and visibly connected to decisions.
Inconsistent timing can also distort results. Comparing a survey conducted during annual bonus communication with one conducted after layoffs or during peak workload may create false interpretations unless the context is recorded.
Confounding factors should be documented in the survey record. Leadership changes, acquisitions, major policy shifts, labor disputes, system implementations, and external market shocks can all influence scores.
Small sample sizes require caution. Segment-level findings can be directionally useful, but HR should avoid naming small teams or drawing hard conclusions when anonymity thresholds or sample reliability are weak.
Overreacting to small fluctuations can create churn. If every minor dip triggers a new initiative, managers and employees may start to treat engagement work as reactive rather than disciplined.
Ignoring neutral responses is another missed opportunity. A rise in neutrality can indicate hesitation or declining conviction before employees become openly unfavorable.
Turning trends into transformation
Comparing and benchmarking engagement survey results over time gives HR a clearer view of how the employee experience is changing. The strongest insights come from consistent questions, stable scales, thoughtful segmentation, and a balanced use of internal and external benchmarks.
The objective is not to chase every movement in the data. It is to identify the patterns that matter, understand the context behind them, and focus action where it can make a measurable difference.
When organizations treat yesterday's survey as a baseline rather than an archive, engagement measurement becomes a strategic system for learning, adjustment, and trust-building.
If you're interested in learning how Sparkbay can help you build a more engaged workforce, you can click here for a demo.