
How do you evaluate departments that do very different work? How do you compare Sales, Legal, and Customer Support?
Avoiding the data you already have is a good place to start.
Your existing data may not be as helpful as you think. Your star employee ratings and business results are both lagging indicators AND they're both biased. Your employee ratings are biased based on calibration practices or the leniency of different managers.
Your business results are biased based on market or conditions outside a team's control.
As a result, the distribution of your data may look flattering, all your departments may have green lights on their scorecards, while in reality, you wind up with unproductive collaborations that result in delayed product launches or customer experiences where it takes too long for customer support to get accurate answers from product teams or spend management teams to learn about budget expenditures.
Everyone may be performing well. But the operating system when teams work together may be lousy.
Many of the department performance templates you find online ask employees to rate how skilled they think their colleagues are or how hard they think their supervisor works. These are peer-appraisal style questions disguised as survey questions and don't generate very helpful performance data.
For instance, if you choose a question on "My teammates are unprofessional" you may not be able to fix that. And if your department scores poorly on this question, it doesn't shed much light on why your work gets delayed.
An important study done by Google's Project Aristotle (involving 180 teams - yes, you've probably seen it cited in presentations over the past several years) concluded that team dynamics are more important than team composition. While this is a useful starting point for discussion, it's important to remember that this was self-reporting data from one company with a very high concentration of smart people.
But the underlying point is that it's a good idea to measure the state of your team's conditions instead of having disputes over which teams have the strongest or smartest people.
So what should you measure?
You should measure a comparable layer of the organization's ability to get things done, aka its enabling conditions. This includes areas such as setting priorities, determining decision rights, and allocating resources, as well as areas of leadership behavior and cross-functional team reliability.
These are all observable by the people answering your survey and act as strong, leading indicators of team performance. Plus, they don't require you to shoehorn areas of work like contract turnaround and pipeline conversion into the same ballpark.
In this article, you'll find over 40 department performance survey questions divided into a helpful framework. This framework divides our questions into an understandable organizing structure to help you compare your teams without turning it into a blame game.
Survey Questions That Reveal How Each Department Is Really Performing - and How to Read the Cross-Department Comparisons
Apples, oranges and engineering teams
Sales focuses on revenue generated and lead conversion rates.
Legal focuses on turnaround times and risk exposure.
Support focuses on ticket resolution times and Customer Satisfaction (CSAT) scores.
These are the metrics each department should focus on. Period.
But when we step back and look at what kinds of conditions each of these departments need to succeed, they start to look a lot more similar.
They all need to know what their priorities are. They need enough resources to accomplish their work. They need to be able to flag problems when they arise.
They need to make effective decisions in a timely manner, and they need internal teams to keep their promises to them.
In short, it's helpful to compare the kinds of conditions that help departments perform well within organizations instead of directly comparing the outputs of various departments.
We can identify six dimensions that apply to most large organizations:
- Clarity of purpose and priorities
- Internal collaboration and psychological safety
- Cross-functional responsiveness
- Tools, staffing and other resources
- Decision speed and quality
- Leadership and manager effectiveness
These items don't tell you whether Legal is doing a good job from a legal advisement standpoint. They don't tell you whether Sales is doing a good job from a customer acquisition standpoint.
What they do tell you is whether that department can do good work without a constant need to put out fires or rely on a few superstar employees to handle the workload.
In his book, Leading Teams, J. Richard Hackman notes that the difference between effective and ineffective teams is not so much how the people within them behave from moment to moment. Instead, it's whether they've established a set of enabling conditions.
These conditions include creating a real team with clear boundaries, setting a compelling direction, putting a structure in place that fits the task, and ensuring an organizational context that supports the team. Designing teams to have these conditions is important. It's also the most helpful focus for organizations to have, since designing for better interpersonal chemistry is hard.
One important technical note about comparing items across different departments: We have to keep in mind that the same data point may have a different meaning in a 2,000-person contact center versus a 30-person legal team.
If companies have the right data and analytics capabilities, they should test for measurement invariance to make sure departments can be placed on a similar scale. Most organizations likely don't have these capabilities, so it's worth focusing on larger patterns across related items instead of putting too much weight into small decimal changes.
Here's another important consideration when comparing different departments: Psychological safety is often measured incorrectly.
As Amy C. Edmondson discusses in The Fearless Organization, her original research in hospitals produced surprising results. It found that one of the better-performing units reported more errors than others. How? Because they felt safe enough to speak up. If your data shows that one department has a suspiciously clean error reports or near-misses, keep this in mind.
Of course, it's not necessary for different departments to have the same scores. A newly merged team may have lower team/role clarity than an established payroll department. Spark runs may have more dramatic workflow fluctuations than an internal strategy team.
Department performance survey questions that deliver meaningful insights
Keep your survey items as close as possible to things employees can actually observe.
For instance, ask whether employees feel like decisions are made in time to be helpful. Don't ask whether the department has an "agile culture" without defining what that means. Otherwise, every department will plug in their own definition and you'll wind up with a survey result that's difficult to interpret or defend in your debrief.
Role and goal clarity
These questions determine whether employees have the information they need to make good decisions about their work:
- I understand how my department's goals support the company's strategy.
- I know the 3 most important priorities for my team.
- I know which work should take priority when there are conflicting deadlines.
- My responsibilities are clear.
- I understand where my responsibilities end and another person's begin.
- When priorities change, leaders promptly explain why.
- My department's measures of success reflect the work we're expected to deliver.
While it's important to ask about general role clarity, don't just pick this question out of the pack and send it out on its own. You want to ensure the employees' satisfaction level is high overall, but your bottlenecks and delays often happen at the intersection of different departments. These intersections are tougher to track down with a general role clarity survey.
The last question is an important one for a team's leader or department heads. If this question receives a lower score than the rest of the role clarity section, team leaders may need to revise their goal setting processes. It's possible the goals they set trickled down from their finance department goals and don't accurately reflect the work they've been asked to complete.
Internal team dynamics
A high-performing department or team does not require team members to agree with each other at all times. Instead, it has a healthy way of dealing with dissent and conflict. Use questions like these to gauge the health of your internal team dynamics:
- People on my team can raise concerns without negative consequences.
- People on my team can admit mistakes and ask for help.
- Disagreements on my department are handled productively.
- My colleagues share useful information before others have to ask for it.
- Work is distributed fairly across my team.
- People follow through on commitments they make to their colleagues.
- My team addresses recurring problems instead of finding ways to work around them.
If the workload fairness question receives a significantly lower score than the rest of the questions in this section, pay special attention to that.
Your department may be relying heavily on a few "hero" employees to perform. Within the survey data, this may be one of the most flattering failures since the department still meets its key targets. But it'll put you in a difficult postition when one of those employees leaves and your cycle time immediately drops.
Ask yourself if this department consistently shows up on your regretted attrition report of top performers.
Cross-functional effectiveness
This is a key advantage of deliverign department-level surveys, because a company-wide average engagement score cannot pick up cross-team challenges.
- When I need help from another department, I know who to contact.
- Other departments respond within a reasonable amount of time.
- Other departments keep the commitments they make to my team.
- My department gives other teams enough notice when our decisions affect their work.
- Responsibilities are clear when work crosses department boundaries.
- Cross-functional decisions involve the right people.
- Teams resolve cross-functional issues without unnecessary escalation.
- Information moves effectively between my department and the teams we depend on.
For example, if your teams escalate issues often, you may have an intake problem that's leading to that frustration. There may not be clearly published request categories for what another department can expect to request, or how fast requests will be completed. As a result, every request is seen as an exception and priority goes to the loudest voices.
Pay attention to the "enough notice" question. This is the only question in this cross-functional effectiveness section where you're asking respondents to rate their own department's behavior towards other teams. This is intentional.
Usually, cross-functional departments report a better experience for themselves than their partner departments would rate them. Here's a quick, cheap way to find out if a department's self-image and their service record with partners is very different.
Processes, tools and resources
Your questions on resourcing should be granular enough to determine whether your departments are under-staffed or dealing with a broken process:
- My team has the tools needed to produce quality work.
- Our main systems support the way we actually work.
- Approval steps move at a reasonable speed.
- My team has enough people to meet normal expectations.
- We can handle peak workloads without relying on sustained overtime.
- Our core processes have clear owners.
- My department stops or changes processes that no longer add value.
When you're considering the staffing and process ownership questions, think in terms of 2x2 matrix. If your company is low on staff but process ownership is strong, you have a real capacity issue your department leaders can take to Finance. If your staff numbers are low and process ownership is low, hiring more people may only beef up a bottleneck.
You'll be facing the same issues in the next budget cycle.
Another thing to consider is the process ownership question. It's very predictive, yet often overlooked. Process accumulation and "stickiness" often happen under a leader's radar, but the people actually carrying out those processes will notice them.
A note of caution about the staffing question: Your employees won't be impartial about their teams' headcount, and every department will say their team isn't staffed enough. In addition, your department leaders may be embarrassed if they suddenly say they're over-staffed, so they may not be truthful about that either. The best value of this question is once it's been aggregated and analyzed in the margin.
High or low scores in this area compared to the org's norm, or a shift in the numbers after a hiring period are what you want to pay attention to.
Leadership and management
Make a clear distinction between your department leaders (heads of departments) and your direct managers (managers or supervisors within that department). Combining these statistics into one "leadership" metric diminishes the strength of your data.
- My manager gives feedback that helps me improve my work.
- My manager removes obstacles that I can't resolve on my own.
- My manager explains how decisions affect our team.
- Department leaders make priorities clear.
- Department leaders explain important decisions openly.
- Leaders address performance problems in a timely way.
- Leaders in my department apply policies consistently.
If a department has weak department leaders but strong direct managers, this could represent a specific issue where your department leaders aren't doing enough to clarify things for their direct managers. It may be that your direct managers are excellent at managing ambiguity and buffering their teams from the effects. On the surface, this may look like a good thing, but these managers are at high risk of burnout and attrition.
When they do leave, your team level scores plummet in the next performance survey cycle.
The opposite may occur in fast-growing functions where there is strong department leadership but weak direct manager scores. It may be that your organization promoted these leaders from individual contributor roles. They may not possess the managerial skills required to effectively support their subordinate teams.
This is one example where understanding the difference between a leadership issue and a direct manager skills issue is important.
You'll often discover that your "Leaders address performance problems in a timely way" question results in the lowest leadership scores in your larger organizations. It's useful to know this, but it's also useful to know which departments buck this trend, and whether those departments also show up in your "Workload fairness" data analysis.
Learning and continuous improvement
- My team regularly reviews what's working and what isn't.
- We use lessons learned from past projects when planning new work.
- Employees at all levels can suggest changes to how we work.
- Good ideas receive a fair hearing no matter who suggests them.
- My department tests small changes before rolling them out widely.
- When a process fails, we look for causes rather than looking for someone to blame.
Open-ended questions that add value
An open-ended text field is most helpful when the question is specific and directed at producing one concrete result:
- What's the biggest obstacle slowing your department down?
- Which process creates the most avoidable work for your team?
- Which decision takes longer than it should?
- Which other department would you most like to work differently with and what would you like to see changed?
- What should your department stop doing?
- What's one thing department leadership should protect because it works well?
- If your team could fix any one cross-functional handoff, what would it be?
A free-form "Any other comments" style question often generates responses that are difficult for you to code and discuss, and impossible to keep from your CEO reading aloud during a meeting.
Two or three open-ended questions are enough for a department level survey. Introducing many open-ended questions will reduce your response rate among people who are willing to thoughtfully type out responses and increase your response rate among people who don't want to complete the survey but happen to have a slow day at work.
Scales, anchors and the silent killers of survey data
Do you want reliable survey data?
Then you need to watch out for a few potential pitfalls when designing your survey scale and survey items.
First, use fully labelled 5-point scale instead of 10-point scale. If you can't write a label for each point on the scale, your respondents will make up their own.
Next, avoid agreement scales as much as possible.
Acquiescence bias is a common sampling bias in surveys. And agreement scales are particularly susceptible to producing this kind of bias.
This is a problem, because agreement scales are popular for good reason. However, the more vulnerable they are to producing sampling bias, the more we need to avoid them.
What's more, agreement scales are particularly vulnerable to sampling bias in certain populations. This includes newer employees, lower level employees, and populations with a culture of high deference to hierarchy.
Avoiding agreement scales while assessing speed of service (or any other task) is not intuitive. How do you assess how fast another team works if you can't rely on the "Strongly Agree" to "Strongly Disagree" scale?
Simple: Instead of asking for an assessment of how fast they work, you ask how often they work within the timeframe agreed upon.
How often does your team get responses from the other team within the timeframe you agreed upon?
Never/ Rarely/ Sometimes/ Often/ Always
And straight answers like these can be compared to actual cycle-time data.
There are two other issues that often trip survey designers up and lead to unreliable, hard-to-compare trend data.
First, keep the wording of coresurvey items the same for all departments.
If the Finance department is asked about "timely decisions" and the Product department is asked about "fast decisions" you can forget about comparing the two departments.
Second, changing response anchors (e.g., from 5-point scale to 10-point scale) in the middle of your trend analysis can make it hard to compare data.
It's more disruptive to your trend data than changing the item stem.
If you do decide to switch up your scale, it's best to use both scales for one cycle and accept that you're starting fresh, time-wise.
Third, it's perfectly acceptable to add local questions. If a department has a specific problem and you want to tailor the department-specific questionnaire, 3 to 5 local questions is fine!
Just make sure the local questions are outside the common index questions.
Don't combine 2 claims in one survey item
Here's a no-no: Combining two claims (or more) in one survey item. This is a big no-no.
For example, an item that says, Leaders communicate clearly and make good decisions puts an employee in a bind if they think leaders communicate well but don't make good decisions.
It's a better idea to split this question into two:
- Department leaders explain important decisions clearly.
- Department leaders make decisions using relevant information.
Similarly, you want to watch out for leading survey item stems or survey items.
If you've ever written a survey item that says, The slow approval process prevents your team from succeeding you've already told respondents what to think.
A better survey item is to simply ask if the work is approved quickly enough.
Should you include reverse-coded items in your survey?
Reverse-coded items are tricky. On the one hand, they help detect straight-lining. On the other hand, reverse-coded items introduce method artifacts that show up as spurious factors when you perform psychometric assessments.
In general, you should include a couple of reverse-coded items in a long survey. But they're no good in a short pulse survey because they take away valuable items and create confusion for respondents who don't want to read too closely.
Should employees devote a lot of time to your employee engagement survey?
Research on web surveys generally suggests that completion rates and response quality start to taper off after 8 - 12 minutes.
This is especially bad news for small departments. Every abandoned survey has a big impact on the results and could push you over your required number for anonymity.
Multilingual organizations also need to consider a special challenge when designing surveys.
When translating an English employee engagement instrument, and then back-translating the instrument using the best practices, organizations may not achieve scale equivalence.
A 5-point scale may not have the same impact on individuals in different countries.
And some countries' response cultures may prefer to avoid choosing the extremes on a scale.
In the grand scheme of things, this introduces a persistent country effect into your department-level comparisons if you operate across regions. Accounting for this effect is important before deciding why a discrepancy exists. Is the department-level leadership of the country region causing it?
When piloting an engagement survey during employee interviews, it's best to conduct think-aloud interviews (rather than a quiet test run.)
Receiving feedback from 6 to 8 employees, with a decent representation of different departments, provides an hour of revelations.
These employers would read the items aloud and provide feedback on what they think each item is asking. This way, issues with survey items could be detected.
Allow other departments to grade the teams they rely on
In addition to conducting a standard survey, consider offering a cross-departmental survey matrix. This helps teams understand how well they operate as an internal service provider to other teams. It may lead to surprising insights.
Ask employees to select which departments they've worked with in a specified time frame. For each selected department/team, show them three items:
- The department responds in a reasonable amount of time
- The department provides work or advice that meets our needs
- The department works constructively with us when priorities conflict
If you prefer a single overall score per department to rank them, you can add a general "How easy is it to work with this department?" question.
Avoid temptation to include questions that mirror your internal eNPS survey. For example, "Would you recommend the Legal department?" isn't a great question since most people don't have a choice when it comes to Legal department anyway. Instead consider a customer effort or satisfaction based question that respondents can meaningfully answer.
This survey will give you a heat map of insights, based on several different patterns, including:
• If a department is seen as a bottleneck, you may receive low speed scores from several partner departments.
• If a department is overloaded, it may receive low speed scores, but an acceptable quality score. You may also receive comments about intake challenges or long waiting periods, which can signal a resourcing or triage issue rather than a competency problem.
• When a department consistently rates its own collaborative efforts highly, but partner departments consistently rank it low, this signals that there are communication issues.
This third scenario is a great example of the value delivered by a cross-department matrix. The Legal Department may think it meets all internal review standards and prides itself on being responsive. Meanwhile, the Sales Department is left waiting because there's never been a formal agreement on categories of requests or expected turnaround times for different categories.
Both departments are likely telling the truth. The cross-department survey helps produce a shared view, rather than competing anecdotal evidence.
There's also a somewhat sneaky fourth pattern worth noting. If a department is rated well by all the internal departments it serves, but poorly on all their internal dimensions, it may be because they're using their own people to pick up the slack. They may be creating a lot of overtime for their staff by handling all the exceptions, refusing to push back on request scope, and more.
They may be fine in the cross-functional survey because they're attempting to look good until they lose two senior employees all at once.
If your department has gatekeeping functions like legal, finance, security, or compliance, another interpretation step is necessary. Part of these teams' jobs is to say no or push back. If your internal customers love them across the board, it may be because they've stopped enforcing anything.
Back up their speed scores with an independent assessment of their control effectiveness before treating a low rating as a performance problem.
Leaders should avoid publishing league tables.
If leaders use these results to shame the lowest-ranked function, there's a risk employees will 1) sugarcoat their ratings moving forward or 2) use the survey as a platform to compete during budget negotiations. Both compromise the integrity of the cross-function data.
On the flip side, some HR leaders argue that publishing the rankings - rather than hiding them - adds useful pressure and is not a "paternalistic" approach to HR.
They argue that exposing functions to public shaming creates a culture where departments want to improve. This can work, but only if the executive team leads by example by taking their own public shaming for poor performance while not threatening the department leader's job.
Whatever you decide, you should ensure each department has a minimum number of responses in order to display ratings for a particular department. In addition, each team's overall rating should only be aggregated from employees with meaningful engagement with that team to ensure fair ratings.
Keep in mind that the minimum response threshold is particularly important when it comes to the cross-departmental matrix. It's easy to end up with only three responses in a cell if you have a department of 40 employees split across ratings for six external departments. A three response rating for a small team risks identifying the reviewers.
When organizing your cross-department matrix, it's important to group areas you anticipate publishing ratings for and not focus on gaining ratings areas for the sake of it.
Read the scoreboard without starting a war
A 3.8 from 12 employees is not quite the same as a 3.8 from 200 employees.
When you present reports, always lead with your response counts and confidence levels, rather than just the rank. If your analytics team is able to, consider using partial pooling or another shrinkage method across several departments. This method gives us unstable estimates for small groups and "shrinks" them towards the overall company average until there's sufficient evidence to rank them differently.
At the very least, highlight lower response bases and refuse to rank departments with too few responses.
Before you present, make a common correction to every executive report: A low response rate does not necessarily indicate a desire to suppress low scores. The non-response bias usually skews data in the opposite direction. The least engaged employees are the least likely to participate, so departments with low participation tend to have inflated results. Consider a sharp drop in participation an important finding in and of itself.
Once you've adjusted your data and reports accordingly, use the following three lenses for interpreting your survey results.
Gap analysis
Compare each department's results to the overall company results (for the same survey question) and to a meaningful internal peer group. Avoid comparing all departments across the board for a "functional unit" comparison.
Small differences of a few tenths of a point are meaningful if they're consistent across several related questions within a given survey dimension. But a small difference on a single question with a small response base is less significant.
Trend analysis
Often, the direction you're heading is more important than where you're at. A department that moves from a 3.1 to a 3.6 because they've made improvements to their approval process is more interesting than a department that has remained static but sits above the average score.
Ensure that you're comparing results from the same survey population. Did you recently undergo a merger or send on a hiring spree? Did you reorganize your teams?
These events can change the composition of respondents, which can lead to perceived improvements or degradations trends that reflect survey population changes rather than meaningful organizational changes.
Variance analysis
Averages can mask differing experiences within a department. If your department has an average engagement score of 4.0, one department may have scored near the top while another scored near the bottom. Take a look at your department's distribution of scores and standard deviation before celebrating average successes.
If there's a bimodal distribution in your department, it's likely a manager-level or location-level issue.
If your survey sample is large enough and your anonymity rules allow it, segment your data based on various factors such as manager, years with the company, job position level, and physical location. This allows you to make observations such as "new hires have a clearer understanding of team priorities compared to employees with 5+ years." This could flag an issue with onboarding documentation or procedures that no longer reflect the current processes.
Employee survey research often shows that variance in engagement across teams is 70% explained by managers, so putting effort into providing options for manager-level reporting can be worthwhile. Of course, you want to maintain your confidentiality standards, but this is one area where that can really be put to the test.
Before your department managers or other stakeholders view survey results, set rules for how to identify key areas of focus. Pre-committing to rules - whether it's looking at large negative gaps, downward trends, or a large distribution - helps resist post-hoc reasoning when a specific group is a senior stakeholder's focus.
At Sparkbay, we help large organizations harmonize their department-level surveys while providing the flexibility each team needs.
You can customize the language of the surveys and run a short, recurring pulse survey to test if a weak handoff or slow decision process is an ongoing challenge.
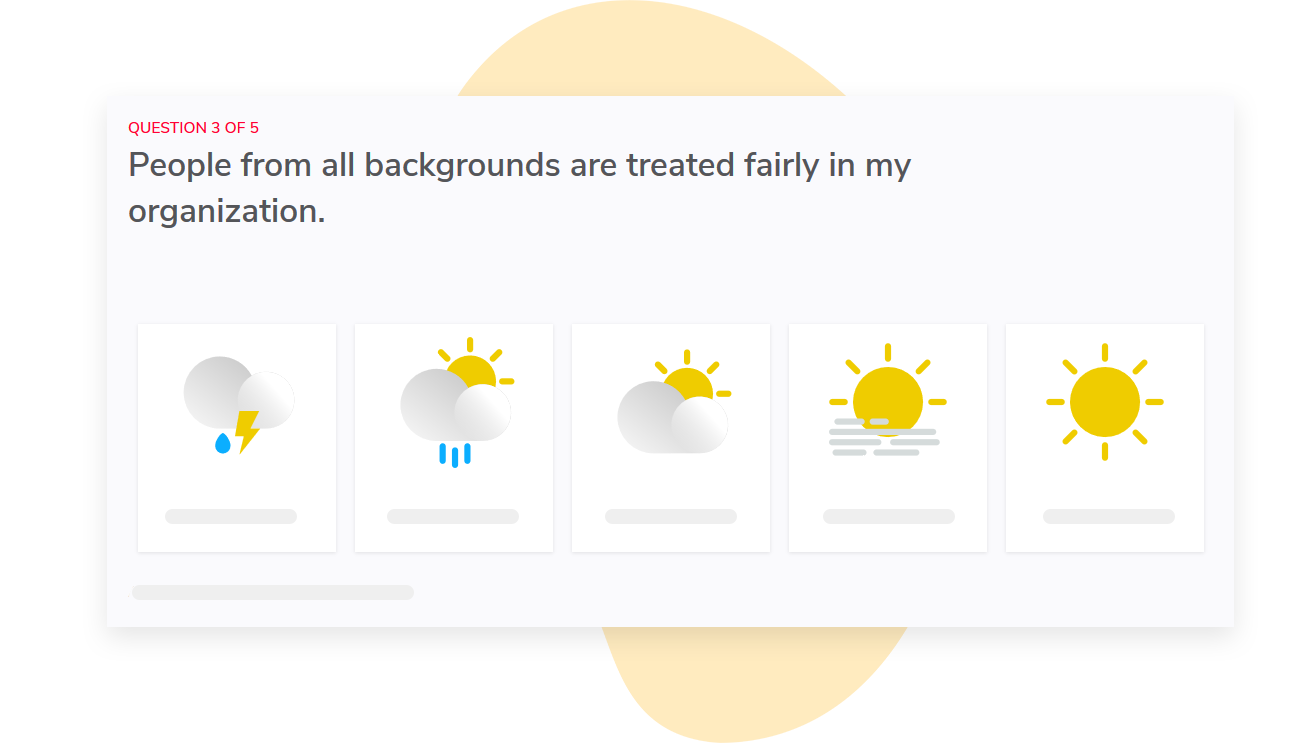
The overall engagement score is reported out of 10. For department-level analysis, our dashboard also displays the department-level results of the survey questions that drive this score to help you uncover where most of the variance is and dive into the details.
But the best insights aren't helpful if they require a constant manual overhaul of your analysis.
Our heat maps allow your HR teams to compare department-level patterns, manager-level, tenure-level, and other relevant groups.
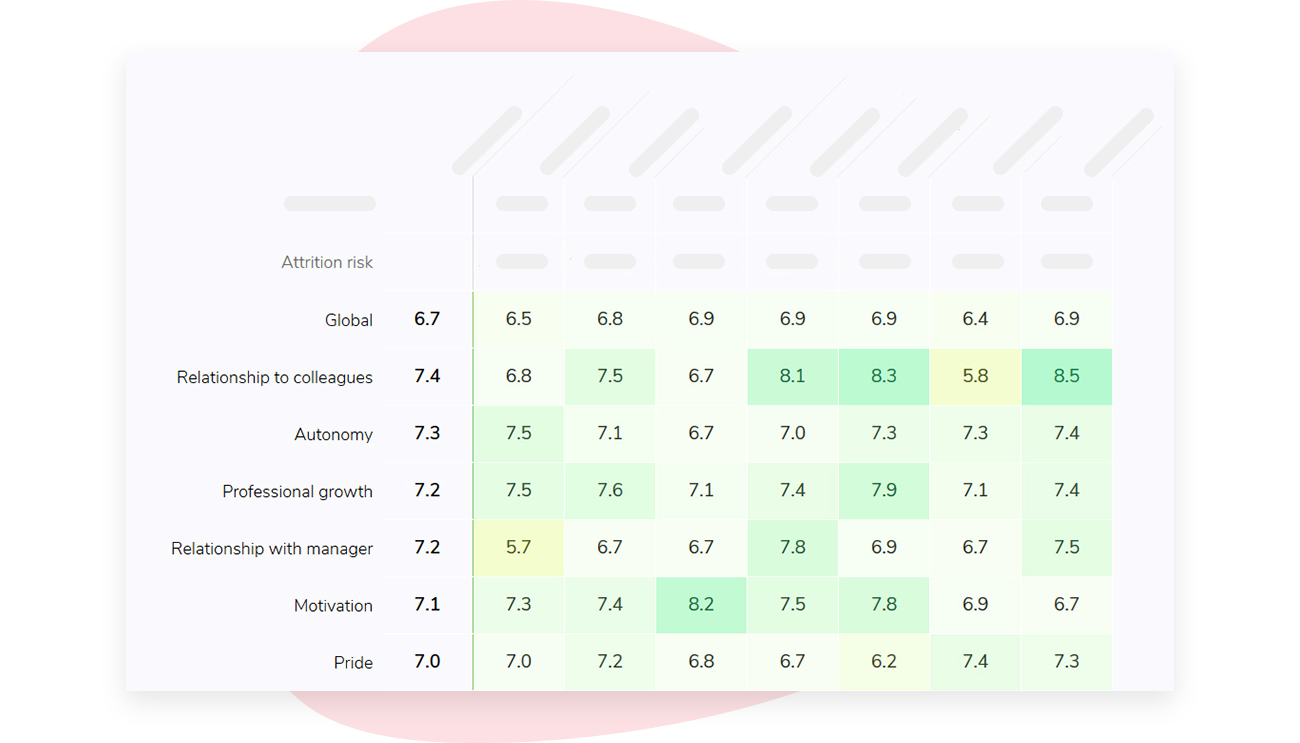
We also automatically assign access based on your organization's reporting structure, so department managers only see the teams they're responsible for, which allows you to maintain confidentiality within your large organization. Manual permissioning at scale can compromise confidentiality without you realizing it.
We also hide results if a group does not meet the minimum threshold of survey responses. The default threshold is 5 responses, but your organization can customize it.
If you're interested in learning how Sparkbay can help you build a more engaged workforce, you can click here for a demo.
Turn department scores into 2 commitments
It's important to consider the cost of not acting.
What does this look like in a tangible sense?
You don't want your best survey data to come from your most open departments. Come the next engagement cycle, you want to ensure the response rate and input quality doesn't dramatically decrease in those departments.
Ideally you want your departments to be just as eager to share their opinions.
So first, aim to produce a headline readout of your engagement survey within 30 days of it concluding.
This might take longer if you have a complex organization, but you can draft an initial summary that focuses on key highlights including:
- where things went well
- where there's room for improvement
- general areas of confusion leaders have.
This second step adds structure to how you conduct your department debriefs. You want these debriefs to be meaningful conversations rather than departments simply defending their scores.
During these debriefs, you should:
- Start by asking department leaders what they believe the area of strength is that they want to protect
- Ask them what the most surprising result was and why by opening up a discussion about the connection between the results and their department's day-to-day operations (e.g., What meeting, approval process, or handoff does this impact?)
- Discuss what aspects of this department are within their control and what requires collaboration with another function or executive decision-making. This information is extremely helpful.
Once that's over, your goal is to create 2 strong commitments (not a laundry list of ideas).
Each commitment must have a clear owner, a first course of action, and a clear date for progress to be checked.
For example, the Finance or Marketing Team may want to commit to clearly defining 3 tiers of spending approval and publishing the expected response turn time for each tier to other departments.
Customer Support may want a commit to organizing weekly check-in meetings with the Product team to discuss outstanding technical questions and concerns. They can also keep track of how many requests are kept open past 7 days.
Notice how these commitments are operational metrics.
This is helpful since survey items often take a long time to change. If you evaluate your action plans based on your survey success (survey score progress) you risk writing off your action plans way before they've had a chance to make operational changes.
You also want to avoid two failure modes:
- When a department's action plan becomes HR'S responsibility. You want that department lead to own the action plan.
- Cross functional action plans that require action from multiple department leaders. It's tough for these action plans to succeed if two department heads can't own or drive the entire project.
An even more complicated failure mode can happen if a cross functional action item doesn't address a structural issue in the department's operating model.
In these instances, an honest survey answer to a department's lowest score may be "Our operating model is structured in such a way that these two functions are constantly at odds with each other." Survey leaders may want to avoid dancing around this structural challenge for fear of upsetting employees.
But it's better for leaders to openly discuss these structural constraints and publicly share the areas leadership does and doesn't intend to change. This helps teams take the survey more seriously by not pretending there are immediate solutions for structural problems they face.
You can also turn your survey results into collaborative opportunities by asking your survey participants to partner with other departments to discuss best practices.
For example, you may want to ask your departments to share best practices for how they approach specific processes or procedures.
To do this, you can put teams from a few departments together and ask them to review each other's mechanics or processes for things like intake, escalation processes, or how priority changes are communicated.
Regarding overall survey cadence, you recommend doing a full annual diagnostic that covers all 6 dimensions with the cross-department matrix. Then, develop a quarterly pulse survey with approximately 8 questions.
Most of these questions can remain the same to track trends and progress while 1 or 2 questions can be updated to check how well each department is living up to its commitments.
The cross-department matrix may require more thought adjustments. Ideally your organization can complete it once every year, since perceptions of partners don't shift too quickly and the various cells within the matrix are sensitive. Frequent requests for individuals to rank their colleagues' departments can spin the diagnostic process into a political exercise.
If you're interested in learning how Sparkbay can help you build a more engaged workforce, you can click here for a demo.